Sales Desk Performance
Goal 🎯
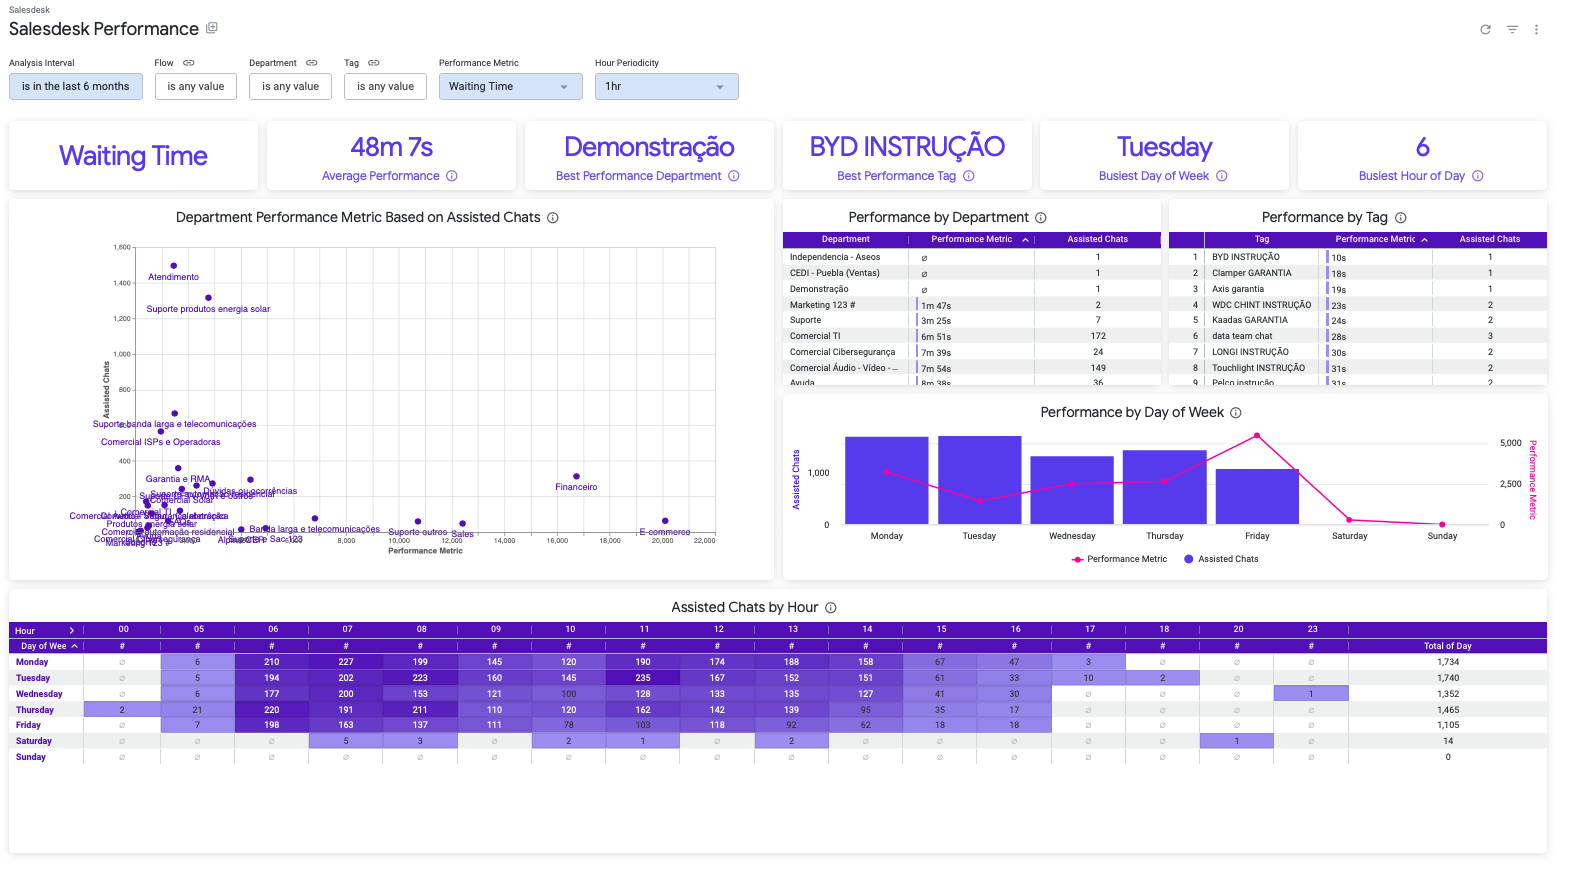
The Sales Desk Performance Dashboard is a tool that helps you understand how well your agents team is performing. It shows you important information like how long users have to wait to get a response from an agent, how long it takes for an agent to help a user among others. With this information, you can see which departments are doing well and which ones need improvement. You can also see if there are certain times of the day or week when there is too much demand for your agents team. This tool can help you make sure your team is performing at its best.
Filters 🔎
- **Analysis Interval
You can select the range of time which will be applied to the analysis.
This filter applies to:
• All cards except “Performance Metric” card
• All tiles
- **Flow
You can select which records will be included in the analysis based on the flow.
This filter applies to:
• All cards except “Performance Metric” card
• All tiles
- **Department
You can select which records will be included in the analysis based on the department where was assisted a chat.
This filter applies to:
• All cards except “Performance Metric” card
• All tiles
- **Tag
You can select which records will be included in the analysis based on the tags which were attached to a chat.
This filter applies to:
• All cards
• All tiles
- **Performance Metric

You can select what performance metric to analyze.
This filter applies to:
• All cards except “Busiest Day of Week” and “Busiest Hour of Day”
• All tiles except “Assisted Chats by Hour”
- **Hour Periodicity
You can select the level of detail to display the “Assited Chats by Hour” tile.
This filter applies to:
• “Assisted Chats By Hour” tile.
Cards Section 🃏
- **Performance Metric
Business Value: This card will show the performance metric to analyze for all the dashboard. This is aligned to your selection in the “Performance Metric” filter.
- **Average Performance
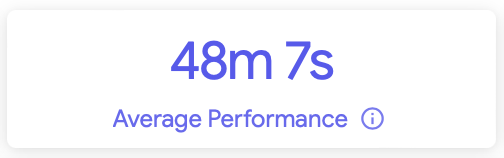
Business Value: This card show all the average performance calculated from all the chats registered during the specific time frame. The performance metric can be selected in the filter and also is displayed in the “Performance Metric” card.
Calculation: Average value for the performance metric selected. They can be:
• Waiting Time: agent first response timestamp - chat opened timestamp.
• First Response Time: agent first response timestamp - chat queued timestamp.
• Response Time: average time between user and agent’s messages.
• Assistance Time: chat closed timestamp - chat opened timestamp.
- **Best Performance Department

Business Value: You can find out which department is performing the best based on the type of performance you are looking at (using the “Performance Metric” filter). This can help you see which departments are doing well and which ones need improvement.
Calculation: Get the top 1 department from the list of departments ordered by the performance metric selected.
- **Best Performance Tag
Business Value: You can find out which tag is performing the best based on the type of performance you are looking at (using the “Performance Metric” filter). This can help you see which areas are doing well and which ones need improvement.
Calculation: Get the top 1 tag from the list of tags ordered by the performance metric selected.
- **Busiest Day of Week
Business Value: This shows which day of the week has the most chats with users. This is important because it helps us understand when there is the most demand for help from our agents, and we can make sure we have enough people available to help customers during those times. The information is calculated for a specific time frame.
Calculation: Get the top 1 day of week from the list of days ordered by the assisted chats metric.
- **Busiest Hour of Day
Business Value: It shows you which hour of the day you have the most chats with users. This can help you understand when you need to have more agents available to help customers during those times. This information is calculated for a specific time frame.
Calculation: Get the top 1 hour of day from the list of hours ordered by the assisted chats metric.
Business Questions
1\.	Which department is performing the best based on the selected performance metric? [Best Performance Department]
2.	Which tag is performing the best based on the selected performance metric? [You should check the Best Performance Tag card]
3.	Which day of the week has the most chats with users? [You should check the Busiest Day of Week card]
4.	Which hour of the day has the most chats with users? [You should check the Busiest Hour of Day card]
5.	How does the performance of each department compare based on the selected performance metric? [You should check the Performance Metric card]
Tiles Section 📊
- **Department Performance Metric Based on Assisted Chats
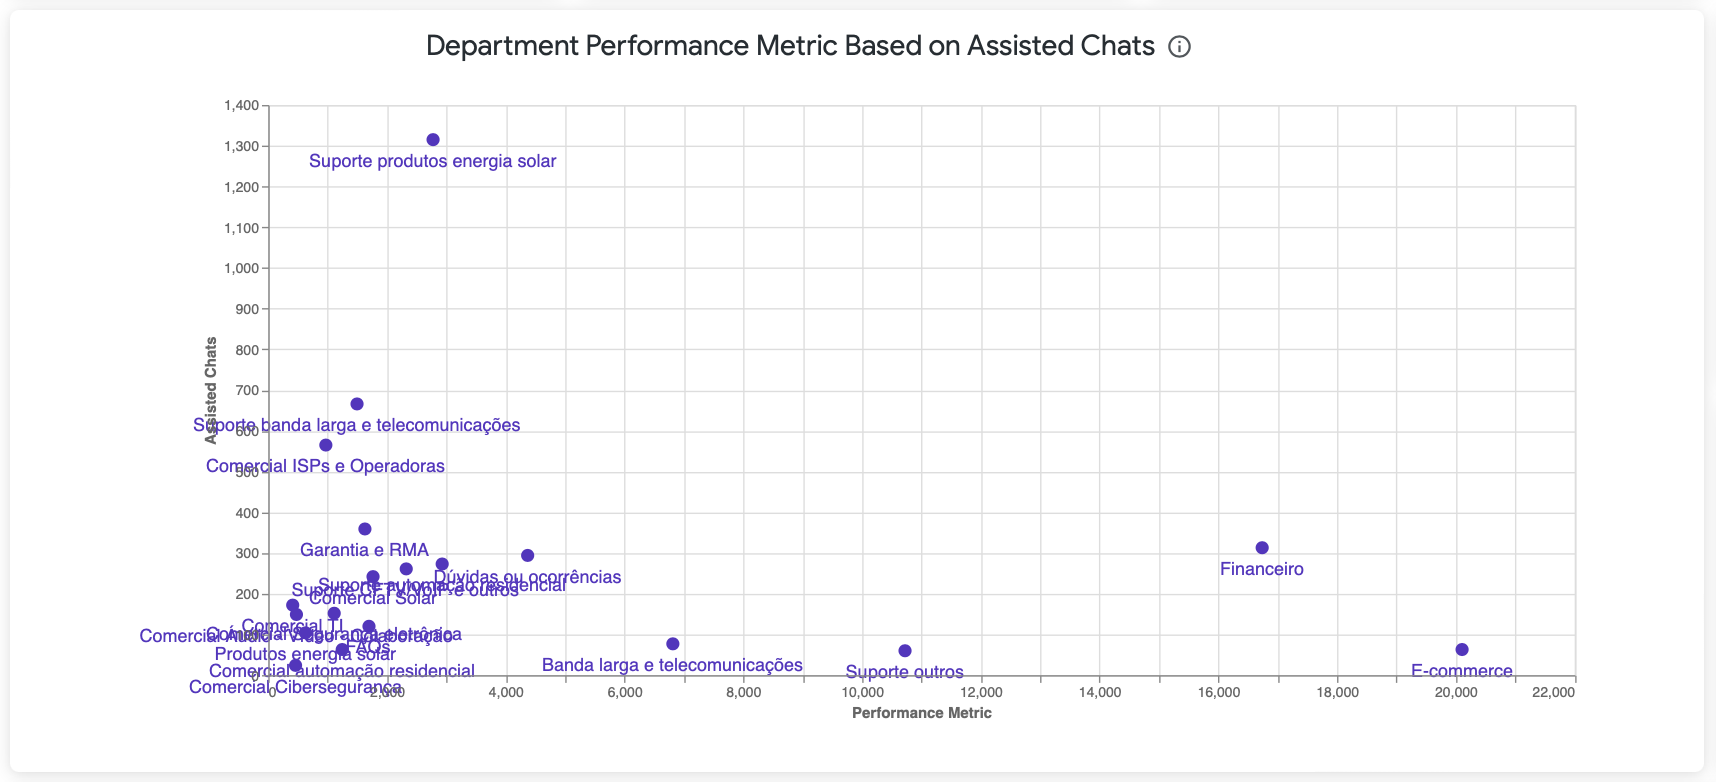
Business Value: This tile helps you to compare different departments based on the performance metric selected (X axis). Also, you can identify if the good or bad performance is cause of the quantity of assisted chats (Y axis). Each point represents a department and it is calculated during a specific time frame.
Calculation:
• For assisted chats: Count distinct of flow_id, ticket_id and rank_agent fields.
- **Performance by Department
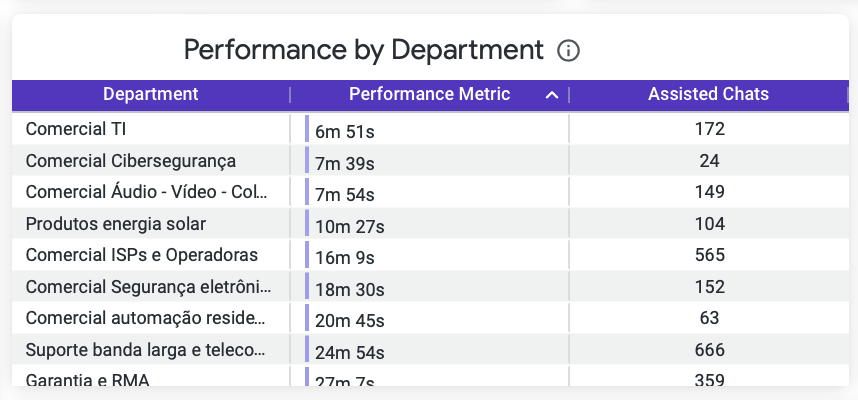
Business Value: This table gives you a detail view of the performance for each department and its assisted chats during a specific time frame. Also, it gives you opportunity to order the data based on the performance or the assisted chats and know what is the best or worst department.
Calculation:
• For assisted chats: Count distinct of flow_id, ticket_id and rank_agent fields.
- **Performance by Tag
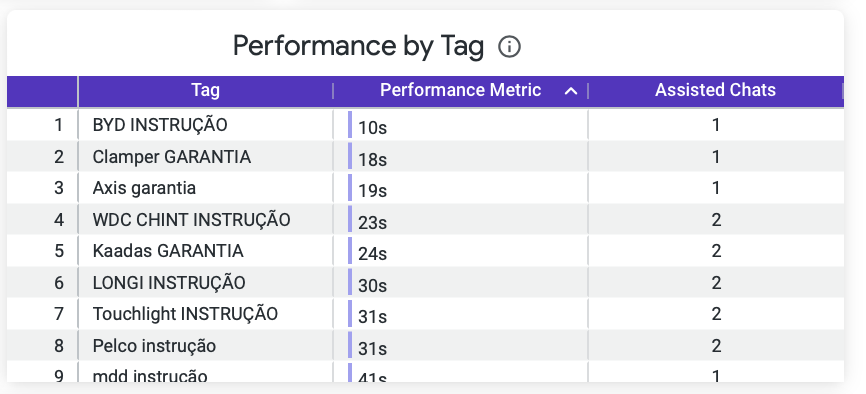
Business Value: This table gives you a detail view of the performance for each tag and its assisted chats during a specific time frame. Also, it gives you opportunity to order the data based on the performance or the assisted chats and know what is the best or worst area.
Calculation:
• For assisted chats: Count distinct of flow_id, ticket_id and rank_agent fields.
- **Performance by Day of Week
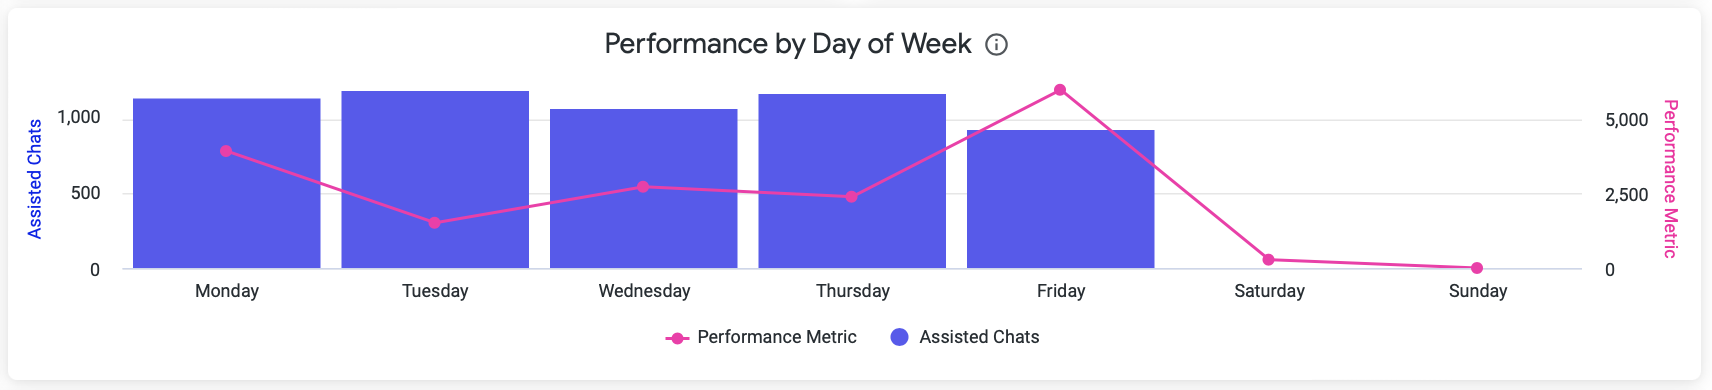
Business Value: This section shows you how many chats were assisted each day of the week and how well the agents performed on average during those chats. This information helps us understand when there is the most demand for help from our agents and how well they are performing during those days.
Calculation:
• For assisted chats: Count distinct of flow_id, ticket_id and rank_agent fields grouped by day of week.
- **Assisted Chats by Hour
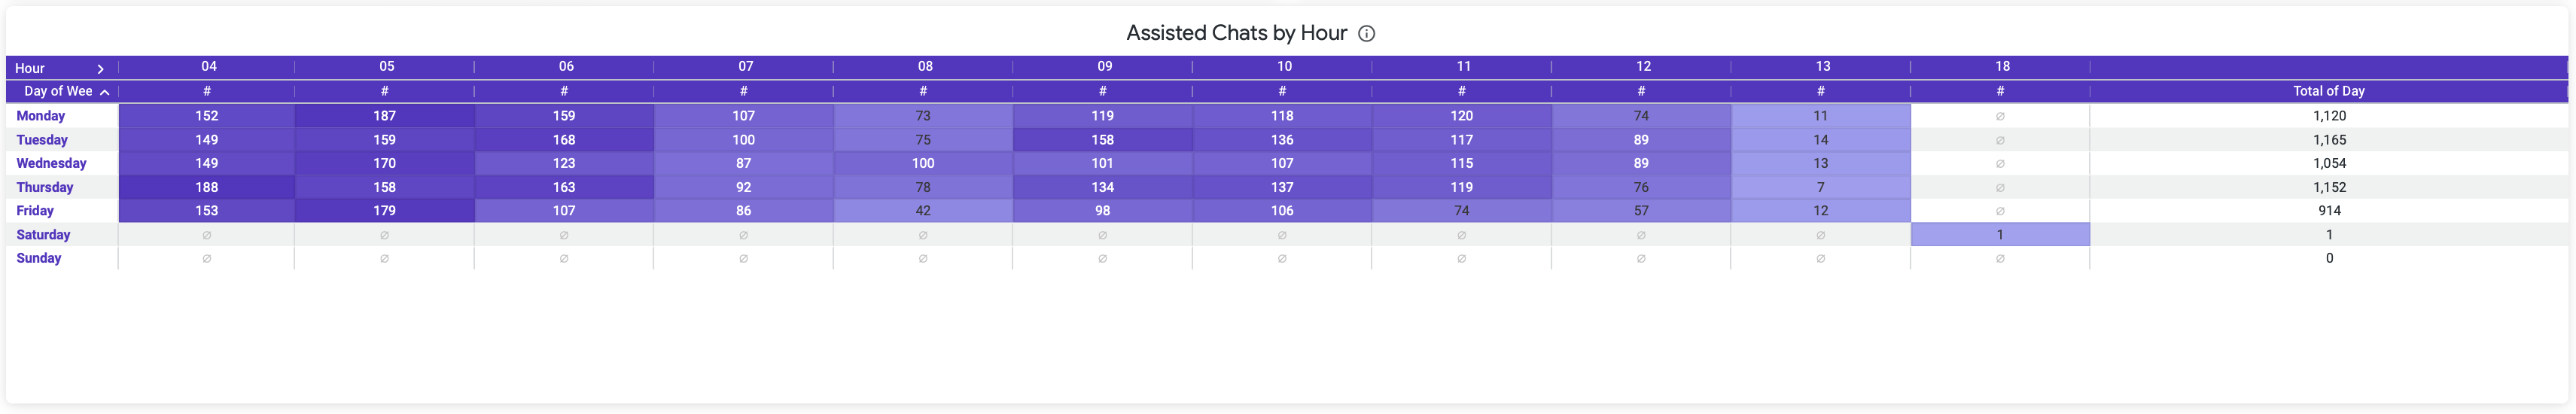
Business Value: This section shows you a detailed heatmap of assisted chats where you can identify what is the busiest day and time. You can detect when you need to have more agents available to support your users.
Calculation:
• For assisted chats: Count distinct of flow_id, ticket_id and rank_agent fields grouped by day of week.
Business Questions
1. Which department is performing the best based on the type of performance you are looking at?
[You should check Department Performance Metric Based on Assisted Chats card]
2. How does the performance of each department compare based on the selected performance metric?
[You should check Performance by Department card]
3. Which tag is performing the best based on the type of performance you are looking at?
[You should check Performance by Tag card]
4. Which day of the week has the most chats with users?
[You should check Performance by Day of Week card]
5. What is the busiest day and time for assisted chats? [You should check Assisted Chats by Hour card]
Updated about 1 year ago