Sales Desk CSAT
Goal 🎯
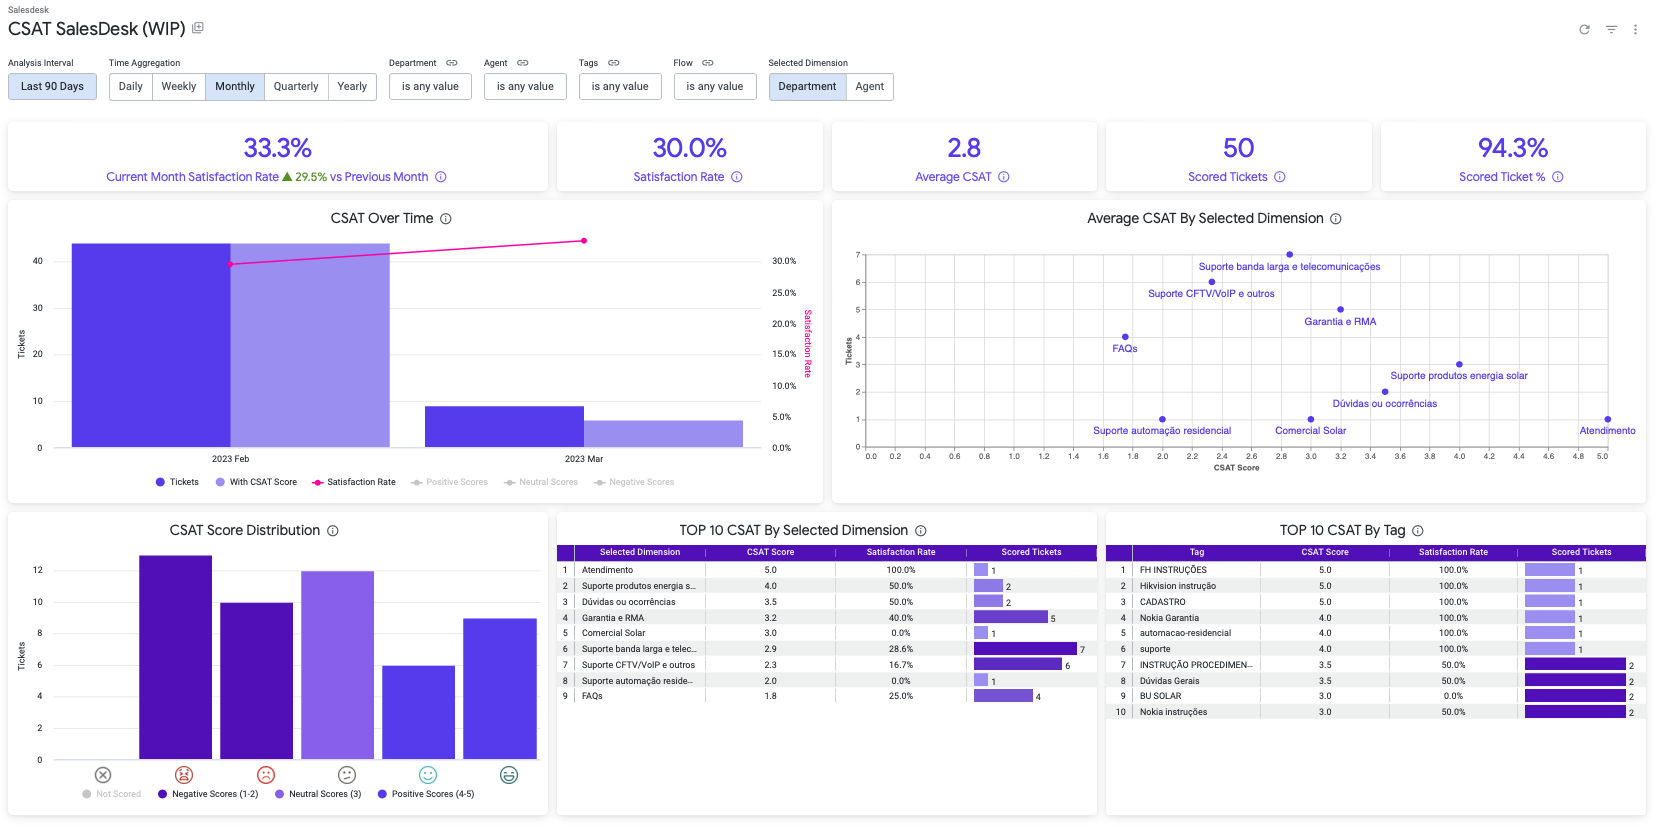
The CSAT Sales Desk dashboard helps you see how well the sales team is serving customers. It shows which areas need improvement, like certain departments or topics. This helps you to take informed decisions which will derived on the team provide better service to customers.
Filters 🔎
- **Analysis Interval

You can select the range of time which will be applied to the analysis.
This filter applies to:
- All cards
- All tiles
- **Time Aggregation

You can select the time aggregation in which data will be analyzed and displayed.
This filter applies to:
- Assisted Chats Over Time
- Assisted Users Over Time
- **Flow

You can select which records will be included in the analysis based on the flow.
This filter applies to:
- All cards
- All tiles
- **Department

You can select which records will be included in the analysis based on the department where was assisted a chat.
This filter applies to:
- All cards
- All tiles
- **Agent

You can select which records will be included in the analysis based on the agent which was assigned to a chat.
This filter applies to:
- All cards
- All tiles
- **Tag

You can select which records will be included in the analysis based on the tags which were attached to a chat.
This filter applies to:
- All cards
- All tiles
- **Selected Dimension

You can select what dimension to use on the “Average CSAT By Selected Dimension” tile.
This filter applies to:
- “Average CSAT By Selected Dimension” tile.
Cards Section 🃏
-
**Current Month Satisfaction Rate


Business Value: You can quickly get the percentage of satisfaction rate for the current month from your users and also know if you’re improving compared to the last month. This will help you know if any recent decision are taking effect on improving the quality of the service.
Calculation: -
**Satisfaction Rate


Business Value: You can quickly get the percentage of satisfaction rate for a specific time frame from your users. This can help you tu know if in previous days, weeks or months you had a better or worse satisfaction rate and let you know if your long way strategy is taking effect on the quality of the service.
Calculation: Percentage of positive scored tickets which is quantitive of positive scored tickets (scores 4 and 5) divided by total quantity of scored tickets. -
**Average CSAT


Business Value: You can know what is the average CSAT value registered by user during a specific time frame. This value will help you understand better what is the common value used by users when they are rating the agent’s service.
Calculation: Average value of CSAT Score for all the scored chats. -
**Scored Tickets


Business Value: You can know the quantity of tickets that were scored by users during a specific time frame. This help you know how many tickets were considered to calculate the satisfaction rate and the average CSAT value.
Calculation: Count distinct of flow_id and ticket_id with CSAT score that is not null. -
**Scored Tickets %


Business Value: You can know the percentage of tickets that were scored by users from all the tickets created in the Sales Desk platform during a specific time frame. This will give you a better idea about how important is your Satisfaction Rate or Average CSAT Score.
Calculation: Count distinct of flow_id and ticket_id with CSAT score that is not null divided by the total quantity of tickets for the flow.
Business Questions-
What is the current month's satisfaction rate? [Current Month Satisfaction Rate]
-
What is the satisfaction rate for a specific time frame? [Satisfaction Rate]
-
What is the average CSAT value registered by a user during a specific time frame? [Average CSAT]
-
How many tickets were scored by users during a specific time frame? [Scored Tickets]
-
What percentage of tickets were scored by users from all the tickets created in the Sales Desk platform during a specific time frame? [Scored Tickets %]
-
Tiles Section 📊
- **CSAT Over Time
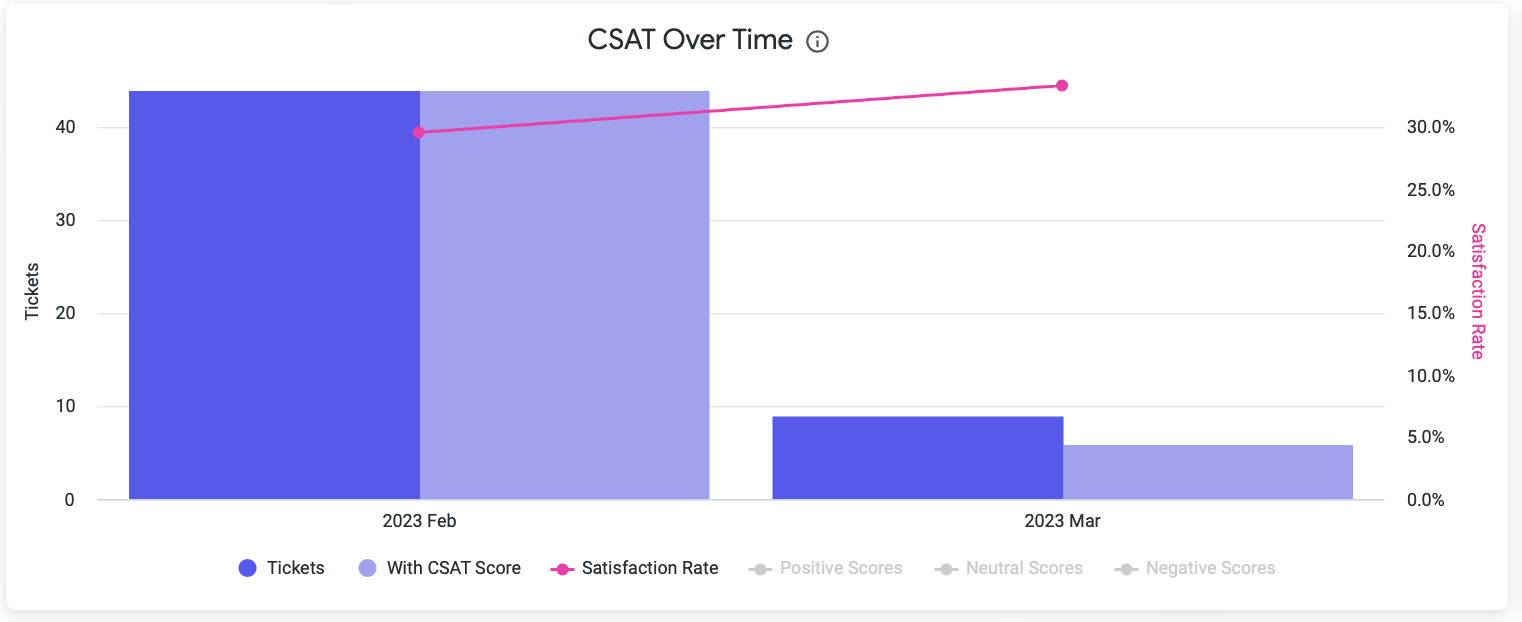 

Business Value: You can get the number of tickets created by users who request agent assistance along the quantity of tickets that were scored over time, this analysis is displayed during a specific time frame. You can identify if a good or poor performance on satisfaction rate is associated to the quantity of tickets received along time.
Calculation:
For each period:
- Tickets: Count distinct of flow_id and ticket_id
- Scored Tickets: Count distinct of flow_id and ticket_id with CSAT score that is not null.
- Satisfaction Rate: Percentage of positive scored tickets which is quantitive of positive scored tickets (scores 4 and 5) divided by total quantity of scored tickets.
- Positive scores: Count distinct of flow_id and ticket_id with CSAT score that is 4 or 5
- Neutral scores: Count distinct of flow_id and ticket_id with CSAT score that is 3
- Negative scores: Count distinct of flow_id and ticket_id with CSAT score that is 1 or 2
- **Average CSAT By Selected Dimension
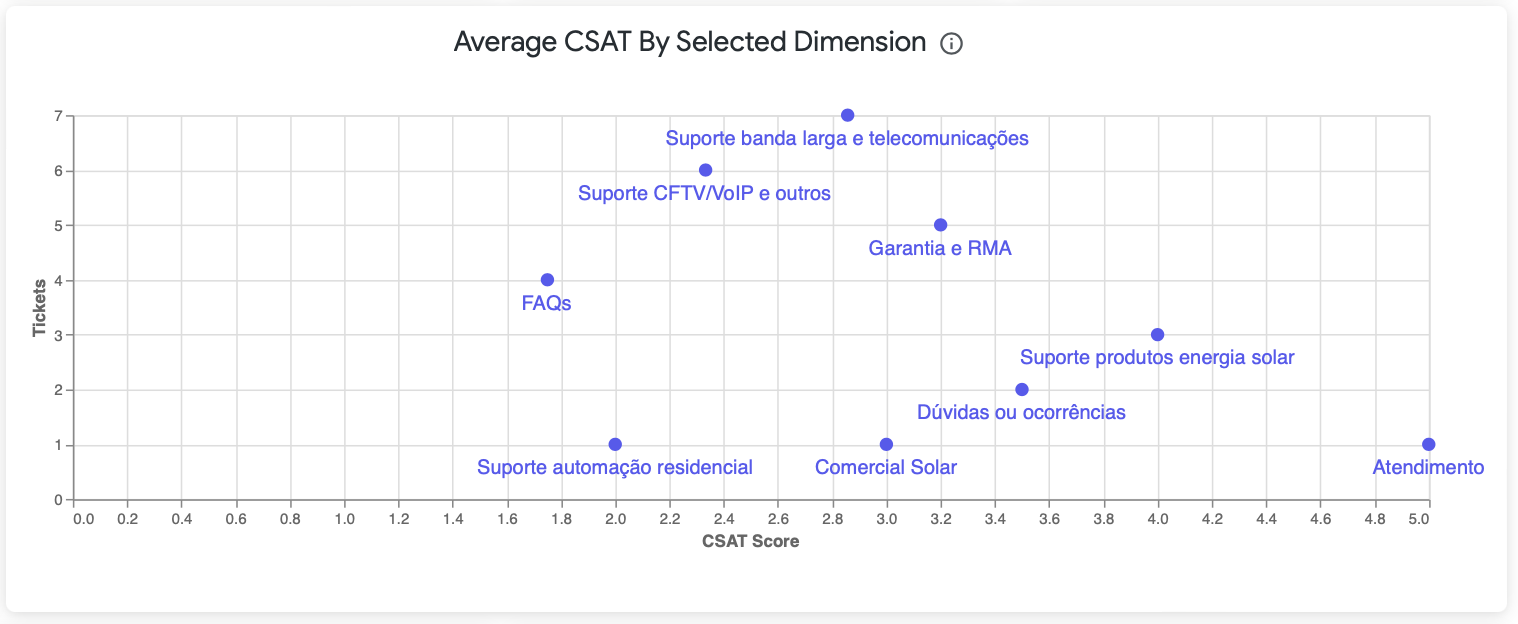 

Business Value: You can identify which departments or agents have good or poor performance on satisfaction rate and let you know if that performance is maybe associated to the quantity of tickets received during a specific time frame. You can select what dimension to analyze (agent or department) using the “Selected Dimension” filter.
Calculation:
For each agent or department:
- Tickets: Count distinct of flow_id and ticket_id with CSAT score that is not null.
- CSAT Score: Average value of CSAT Score for all the scored chats.
- **CSAT Score Distribution
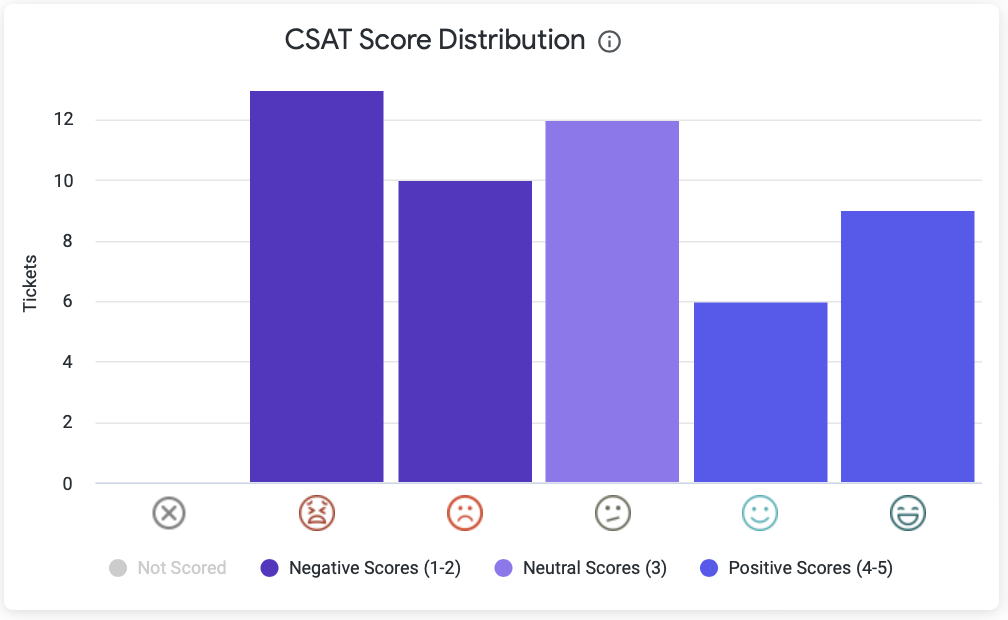 

Business Value: This tile will help you to understand the distribution of the quantity of tickets between all the possible scores that the user gives. You can identify easily if there’s a a gap of improvement if you see so many neutral or negative scores compared to the positive ones.
Calculation:
For each score category (not scored, negative, neutral and positive):
- Tickets: Count distinct of flow_id and ticket_id with CSAT score that is not null.
- **Top 10 CSAT By Selected Dimension
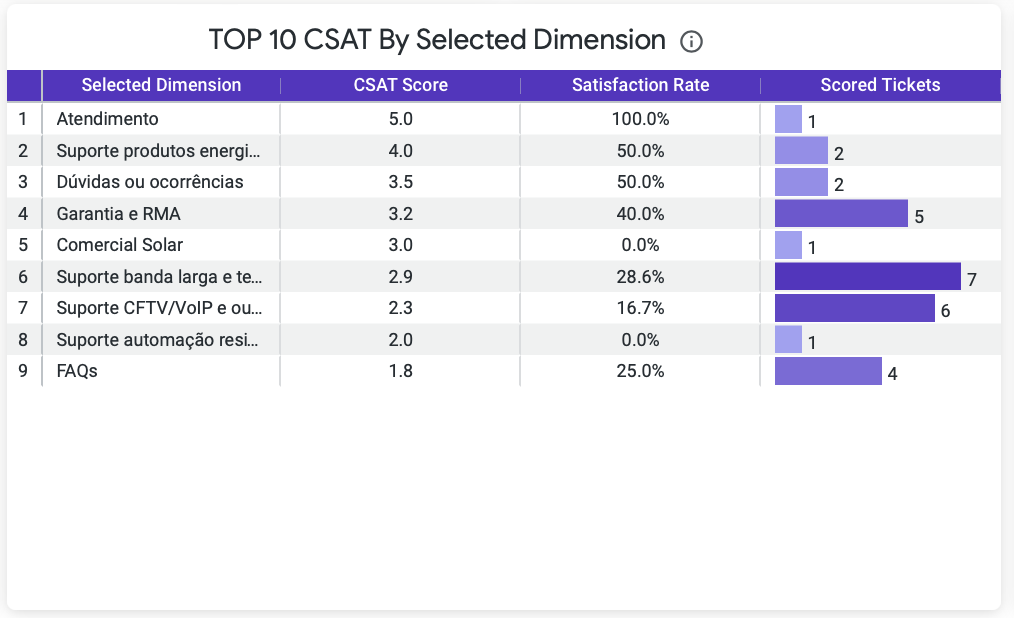 

Business Value: You can get the list of agents or departments orderer by many of the metrics related to CSAT. With this tile you can get the best or worst departments or agents and also get the data (download) to make your own deeper analysis.
Calculation:
For each agent or department:
- CSAT Score: Average value of CSAT Score for all the scored chats.
- Satisfaction Rate: Percentage of positive scored tickets which is quantitive of positive scored tickets (scores 4 and 5) divided by total quantity of scored tickets.
- Scored Tickets: Count distinct of flow_id and ticket_id with CSAT score that is not null.
- **Top 10 CSAT By Tag
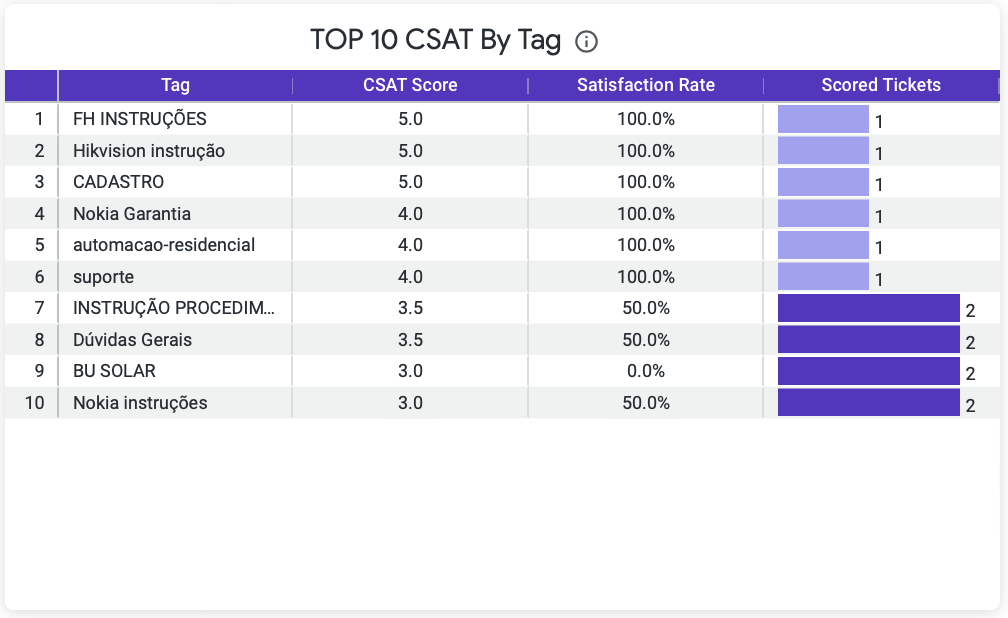 

Business Value: You can get the list of tags orderer by many of the metrics related to CSAT. With this tile you can get the best or worst areas or agents and also get the data (download) to make deeper analysis.
Calculation:
For each tag:
-
CSAT Score: Average value of CSAT Score for all the scored chats.
-
Satisfaction Rate: Percentage of positive scored tickets which is quantitive of positive scored tickets (scores 4 and 5) divided by total quantity of scored tickets.
-
Scored Tickets: Count distinct of flow_id and ticket_id with CSAT score that is not null.
Business Questions
- What is the CSAT score over time in a daily/weekly/monthly/quarterly basis? [CSAT Over Time]
- What is the average CSAT value and quantity of tickets by department or agent? [Average CSAT By Selected Dimension]
- What is the distribution of CSAT scores? [CSAT Score Distribution]
- Who are the top agents or departments by CSAT score? [Top 10 CSAT By Selected Dimension]
- What are the top tags by CSAT score? [Top 10 CSAT By Tag]
Updated about 1 year ago