Sales Desk Agents Performance
Filters 🔎
-
**Analysis Interval
You can select the range of time which will be applied to the analysis.
This filter applies to:
• All cards
• All tiles
-
**Time Aggregation
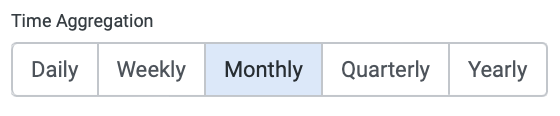
You can select the time aggregation in which data will be analyzed and displayed.
This filter applies to:
• Assisted Chats Over Time
• Assisted Users Over Time
-
**Flow
You can select which records will be included in the analysis based on the flow.
This filter applies to:
• All cards
• All tiles
-
**Department
You can select which records will be included in the analysis based on the department where was assisted a chat.
This filter applies to:
• All cards
• All tiles
-
**Agent
You can select which records will be included in the analysis based on the agent which was assigned to a chat.
This filter applies to:
• All cards
• All tiles
-
**Tag
You can select which records will be included in the analysis based on the tags which were attached to a chat.
This filter applies to:
• All cards
• All tiles
-
**Performance Metric
You can select what performance metric you want to analyze in the dashboard. It can be one of these:
• Waiting Time
• First Response Time
• Response Time
• Assistance Time
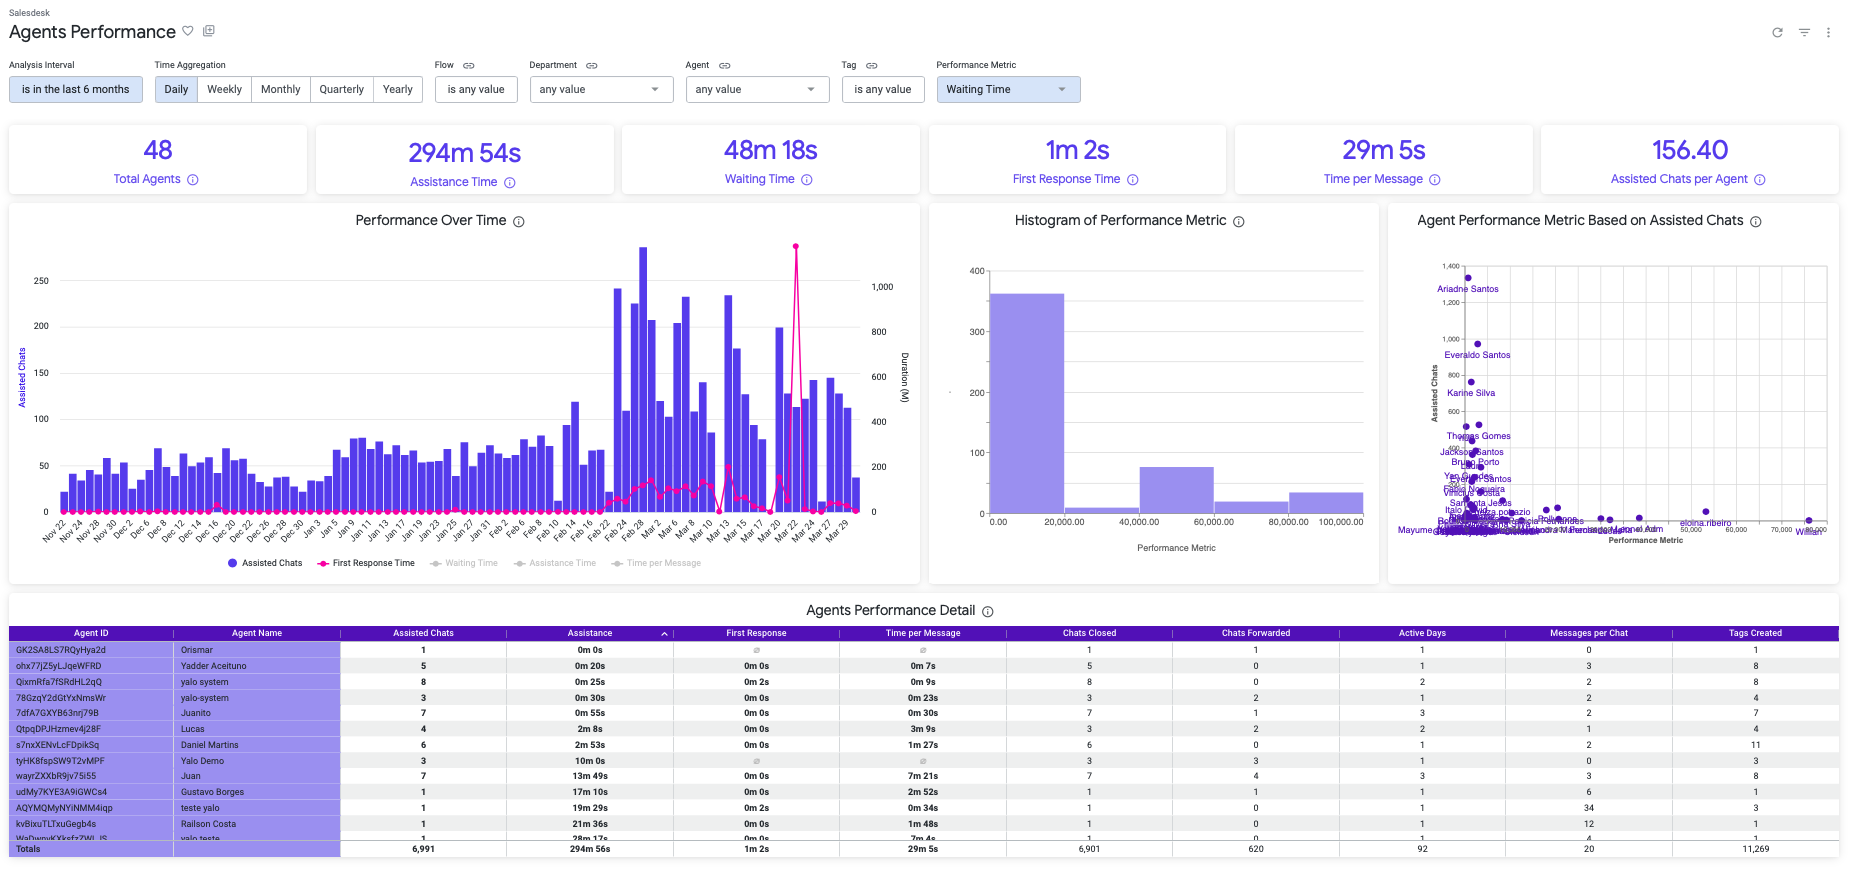
Cards Section 🃏
-
**Total Agents

Business Value: You can know the quantity of agents have supported at least one chat in Sales Desk platform during a specific time frame.
Calculation: Count distinct of agent_id, flow_id
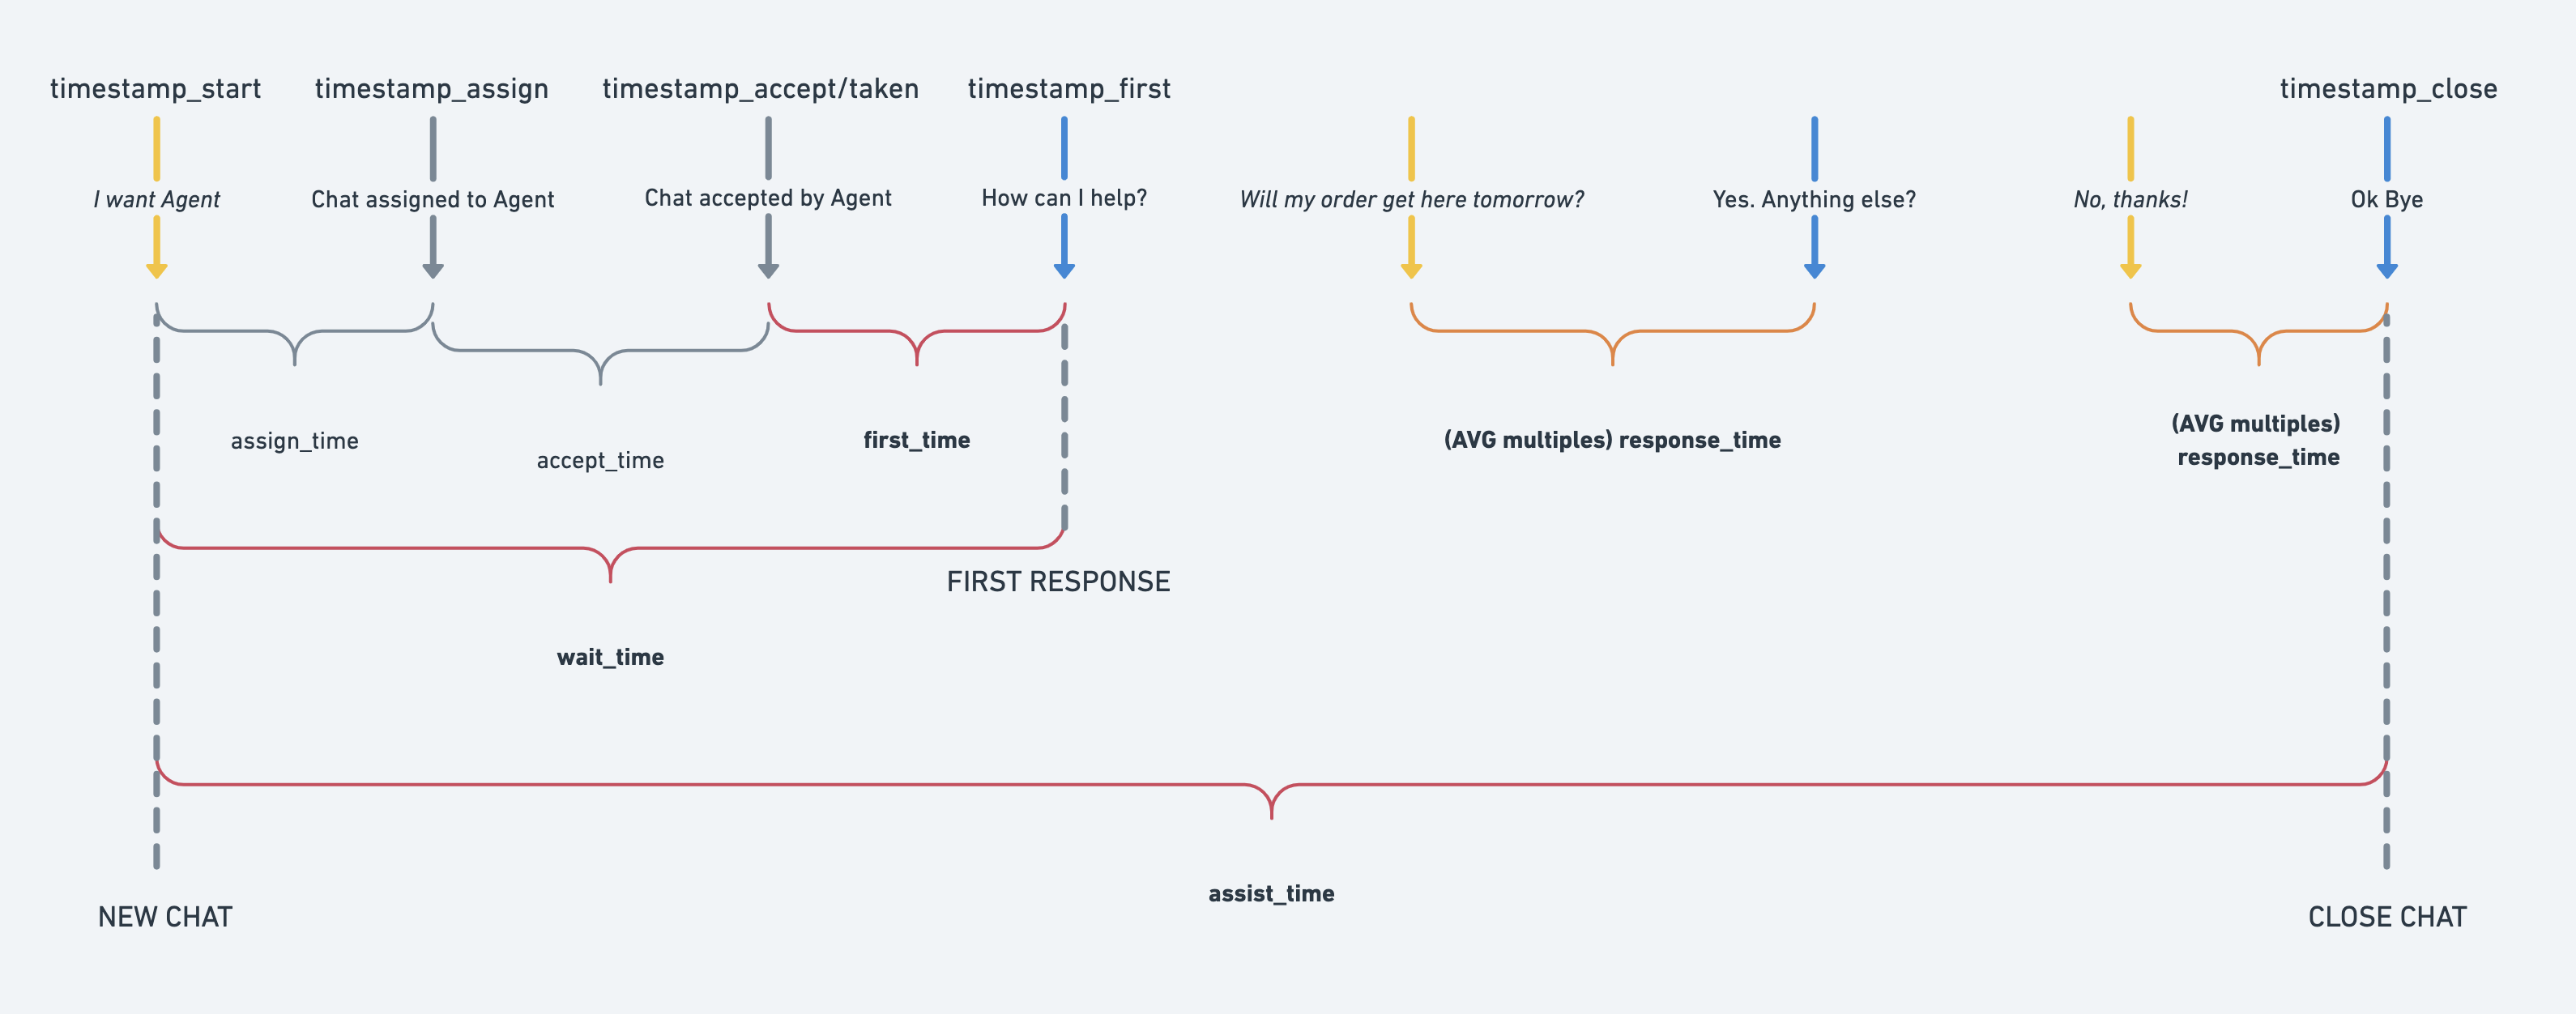
Check below how each time metric is evaluated based on the process.
-
**Assistance Time

Business Value: You can know what’s the average duration time of assistance that an agent takes to assist a user during a specific time frame. This is an important performance metric because you can discover how good or bad is the overall performance from all your agents.
Calculation: Average assistance time value from all the chats registered.
-
**Waiting Time

Business Value: You can know what’s the average duration time of waiting time that an user have to wait until receive the first reply from the agent during a specific time frame. This is an important performance metric because you can understand how good or bad is the satisfaction from the user.
Calculation: Average waiting time value from all the chats registered.
-
**First Response Time

Business Value: You can know what’s the average duration time that agent take to give the first reply to an user since the chat is assigned or taken by the agent. This is an important performance metric because you can understand how quick the agents react to a chat that was assigned.
Calculation: Average first response value from all the chats registered.
-
**Time per Message

Business Value: You can know what’s the average duration time that agent take to give the a reply to an user during all the assisted chat interaction. This is an important performance metric because you can understand how quick the agents react to a user message.
Calculation: Average agent response value from all the chats registered.
-
**Assisted Chats Per Agent

Business Value: You can know as average how many chats are assigned by agent during a specific time frame. This can give you an idea how much loaded are the agents that support your users.
Calculation: Quantity of assisted chats divided by total agents.
Business Questions
1. How many agents have supported at least one chat in Sales Desk platform during a specific time frame?
[ Check the Total Agents card]
2. What's the average duration time of assistance that an agent takes to assist a user during a specific time frame? [Check the Assistance Time card]
3. What's the average duration time of waiting time that a user has to wait until receiving the first reply from the agent during a specific time frame? [Check the Waiting Time card]
4. What's the average duration time that an agent takes to give the first reply to a user since the chat is assigned or taken by the agent? [Check the First Response Time card]
5. What's the average duration time that an agent takes to give a reply to a user during all the assisted chat interaction? [Check the Time per Message card]
6. How many chats are assigned by agent during a specific time frame, on average?
[Check the Assisted Chats per Agent card]
Tiles Section 📊
-
**Performance Over Time
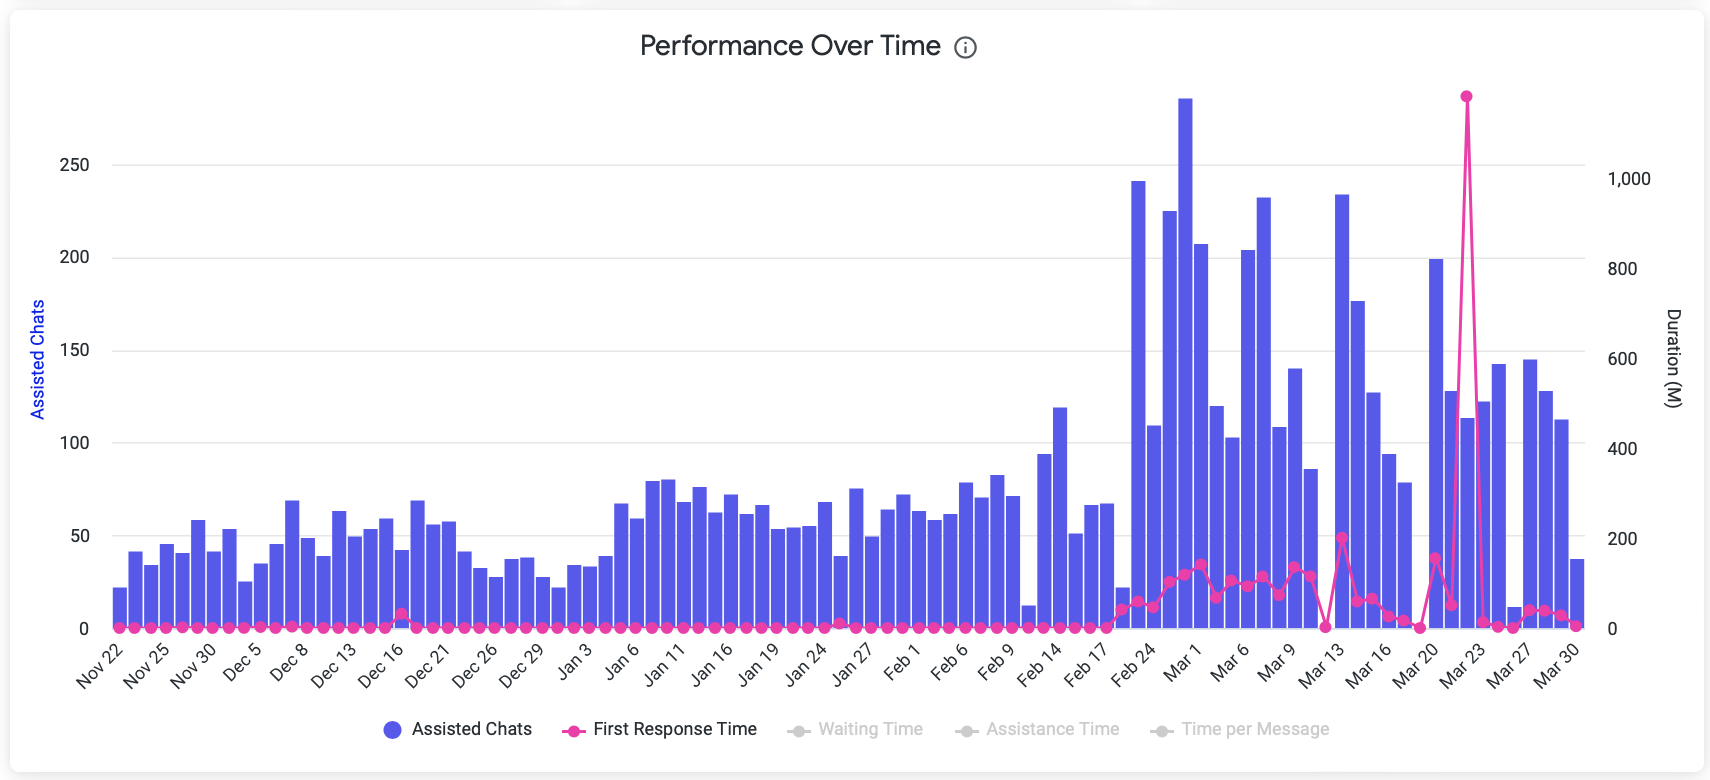
Business Value: You can know how is the performance from your agents in different areas (waiting time, first response, assistance time, time per message) during a specific time frame. Also, you can understand if that performance is caused by a quantity of assisted chats and give you insights about what decision you can take to improve the performance.
Calculation:
• Waiting Time: agent first response timestamp - chat opened timestamp.
• First Response Time: agent first response timestamp - chat queued timestamp.
• Response Time: average time between user and agent’s messages.
• Assistance Time: chat closed timestamp - chat opened timestamp.
• Assisted Chats: Count distinct of flow_id, ticket_id and rank_agent fields.
-
**Histogram of Performance Metric
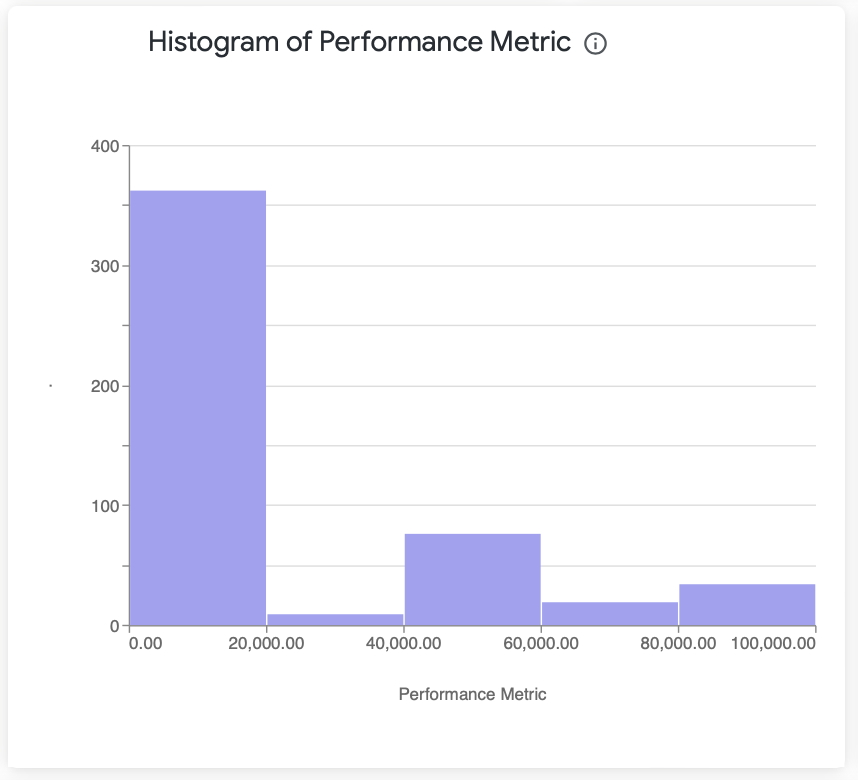
Business Value: You can understand how really is the distribution of any of the performance metrics (waiting time, first response time, assistance time, response time). For example, you can have a good average of assistance time, but with this tile you can notice that there are a group with a very good performance and also another group with very poor performance, so you have there a big gap of improvement if you take that group and analyze what is the reason of the bad performance.
Calculation: Distribution of the quantity of chats (Y axis) along the duration time (X axis) of the performance metric.
-
**Agent Performance Metric Based on Assisted Chats
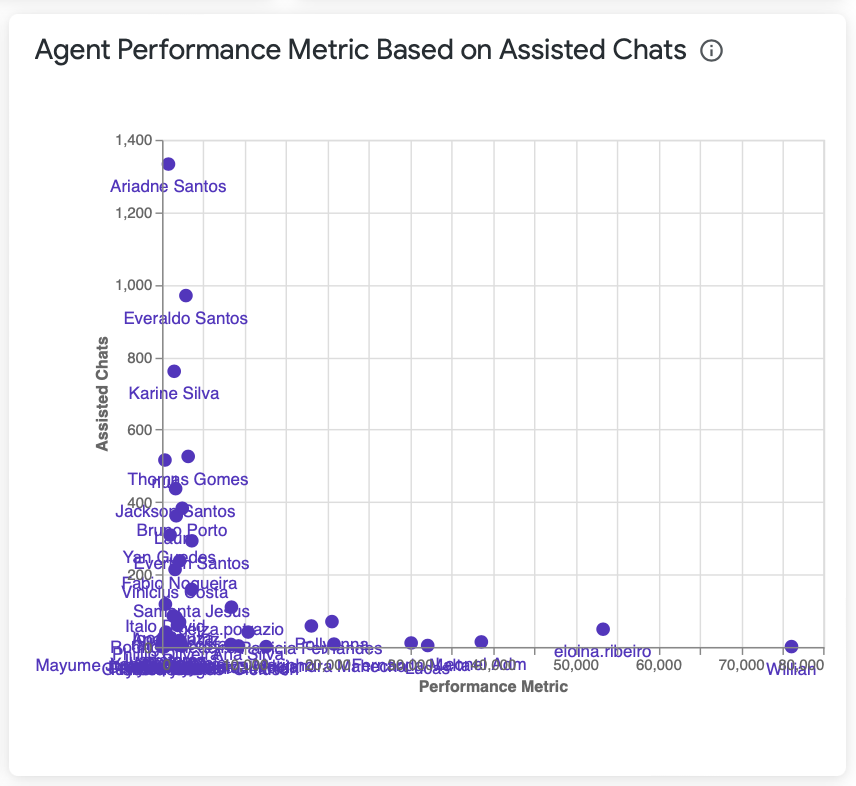
Business Value: This tile helps you to compare different agents based on the performance metric selected (X axis). Also, you can identify if the good or bad performance is cause of the quantity of assisted chats (Y axis). Each point represents an agent and it is calculated during a specific time frame.
Calculation:
• For assisted chats: Count distinct of flow_id, ticket_id and rank_agent fields by agent.
-
**Agents Performance Detail
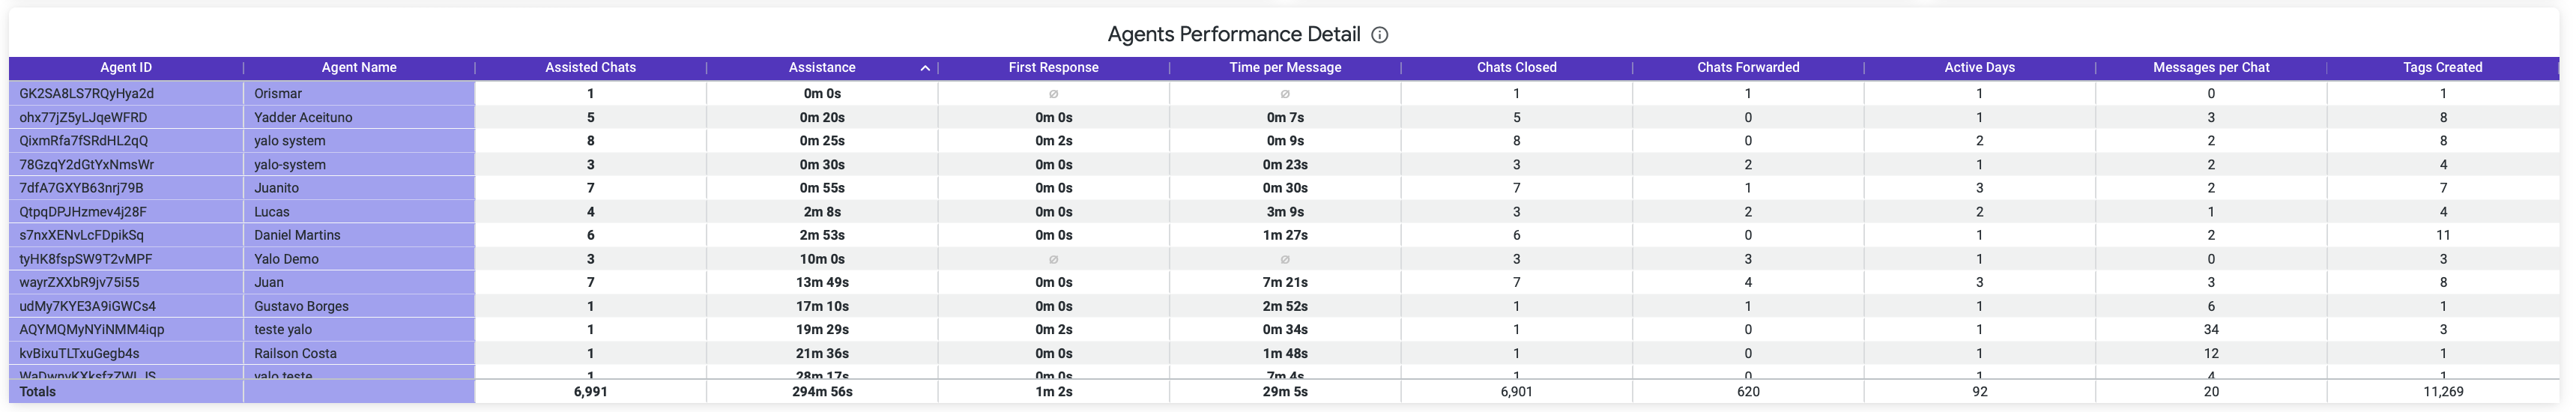
Business Value: This tile helps you to get a detailed information of performance for each agent during a specific time frame. You can order each of the performance metric and get who are the best and worst agents regarding to the metric that you’re interested.
Calculation:
• For assisted chats: Count distinct of flow_id, ticket_id and rank_agent fields by agent.
• Waiting Time: average value of waiting time (agent first response timestamp - chat opened timestamp) by agent.
• First Response Time: average value of first response time (agent first response timestamp - chat queued timestamp) by agent.
• Response Time: average time between user and agent’s messages by agent.
• Assistance Time: average value of assistance time (chat closed timestamp - chat opened timestamp) by agent.
• Assisted Chats: Count distinct of flow_id, ticket_id and rank_agent fields by agent.
Business Questions
1. How is the performance from your agents in different areas (waiting time, first response, assistance time, time per message) during a specific time frame? [ Check the Performance Over Time Card]
2. How really is the distribution of any of the performance metrics (waiting time, first response time, assistance time, response time)? [Check the Histogram of Performance Metric Card]
3. How do different agents compare based on the performance metric selected? Also, can the good or bad performance be caused by the quantity of assisted chats? [Check the Agent Performance Metric Based on Assisted Chats Card]
4. Who are the best and worst agents regarding to the performance metric that you’re interested?
[Check the Agents Performance Detail Card]
Updated 5 months ago