Sales Desk Overview
# Goal 🎯
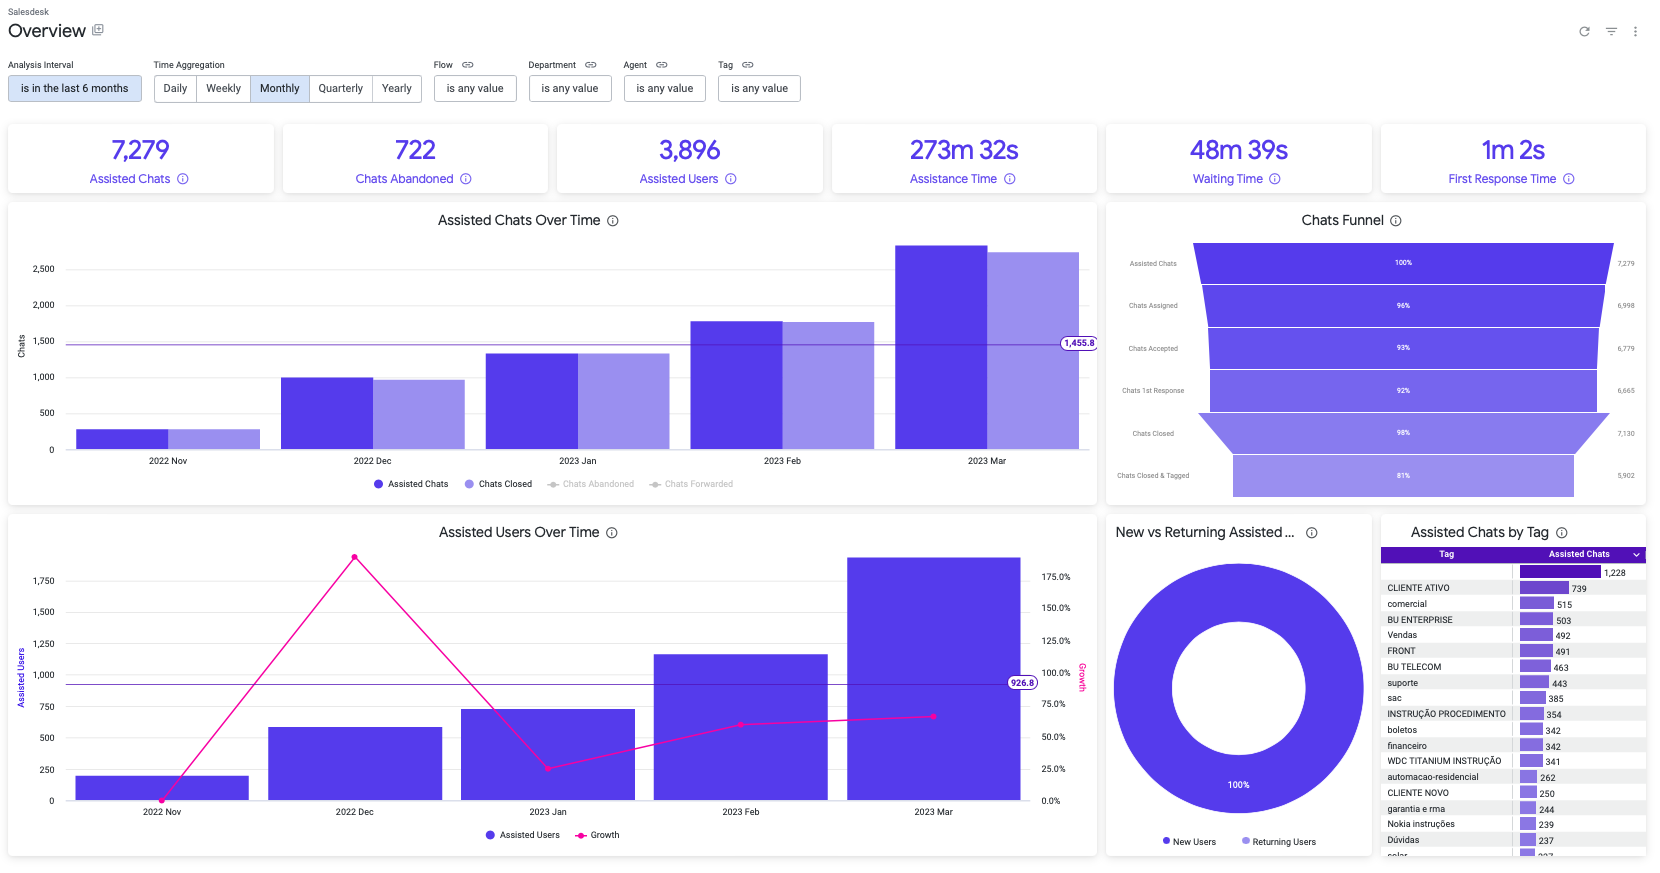
The Sales Desk dashboard provides a comprehensive overview of the platform's performance, including the number and growth of assisted chats and users over a specified timeframe. This data allows for a deeper understanding of human agent assistance requests and the most commonly used tags for those chats. Overall, the dashboard provides key insights into the performance of the Sales Desk platform.
Filters 🔎
- **Analysis Interval
You can select the range of time which will be applied to the analysis.
This filter applies to:
• All cards
• All tiles
- **Time Aggregation
You can select the time aggregation in which data will be analyzed and displayed.
This filter applies to:
• Assisted Chats Over Time
• Assisted Users Over Time
- **Flow
You can select which records will be included in the analysis based on the flow.
This filter applies to:
• All cards
• All tiles
- **Department
You can select which records will be included in the analysis based on the department where was assisted a chat.
This filter applies to:
• All cards
• All tiles
- **Agent
You can select which records will be included in the analysis based on the agent which was assigned to a chat.
This filter applies to:
• All cards
• All tiles
- **Tag
You can select which records will be included in the analysis based on the tags which were attached to a chat.
This filter applies to:
• All cards
• All tiles
Cards Section 🃏
- **Assisted Chats
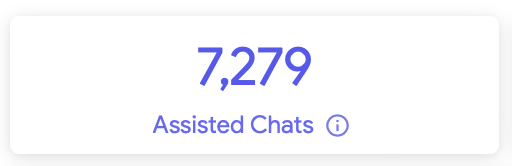
Business Value: This card shows how many chats were helped by a human agent during a specific time frame. It counts each unique chat and the number of agents who helped with it. Keep in mind that one conversation can have multiple chats if it was forwarded to more than one agent.
Calculation: Count distinct of flow_id, ticket_id and rank_agent fields.
- **Created Tickets
Business Value: This card shows how many tickets were created by a users in Salesdesk during a specific time frame. It counts each unique ticket generated. Keep in mind that one ticket can have multiple chats if it was forwarded to more than one agent.
Calculation: Count distinct of flow_id, ticket_id.
- **Chats Abandoned
Business Value: This card shows how many chats were abandoned by the user during a specific time frame. It counts each unique chat where there wasn’t any response from the user and the system closed the conversation.
Calculation: Count distinct of flow_id, ticket_id and rank_agent fields where the abandoned flag was activated.
- **Assisted Users
Business Value: This card shows how many distinct users requested agent assistance on the flow during a specific timeframe.
Calculation: Count distinct of flow_id, user_id fields in the analysis interval.
Check below how each time metric is evaluated based on the process.
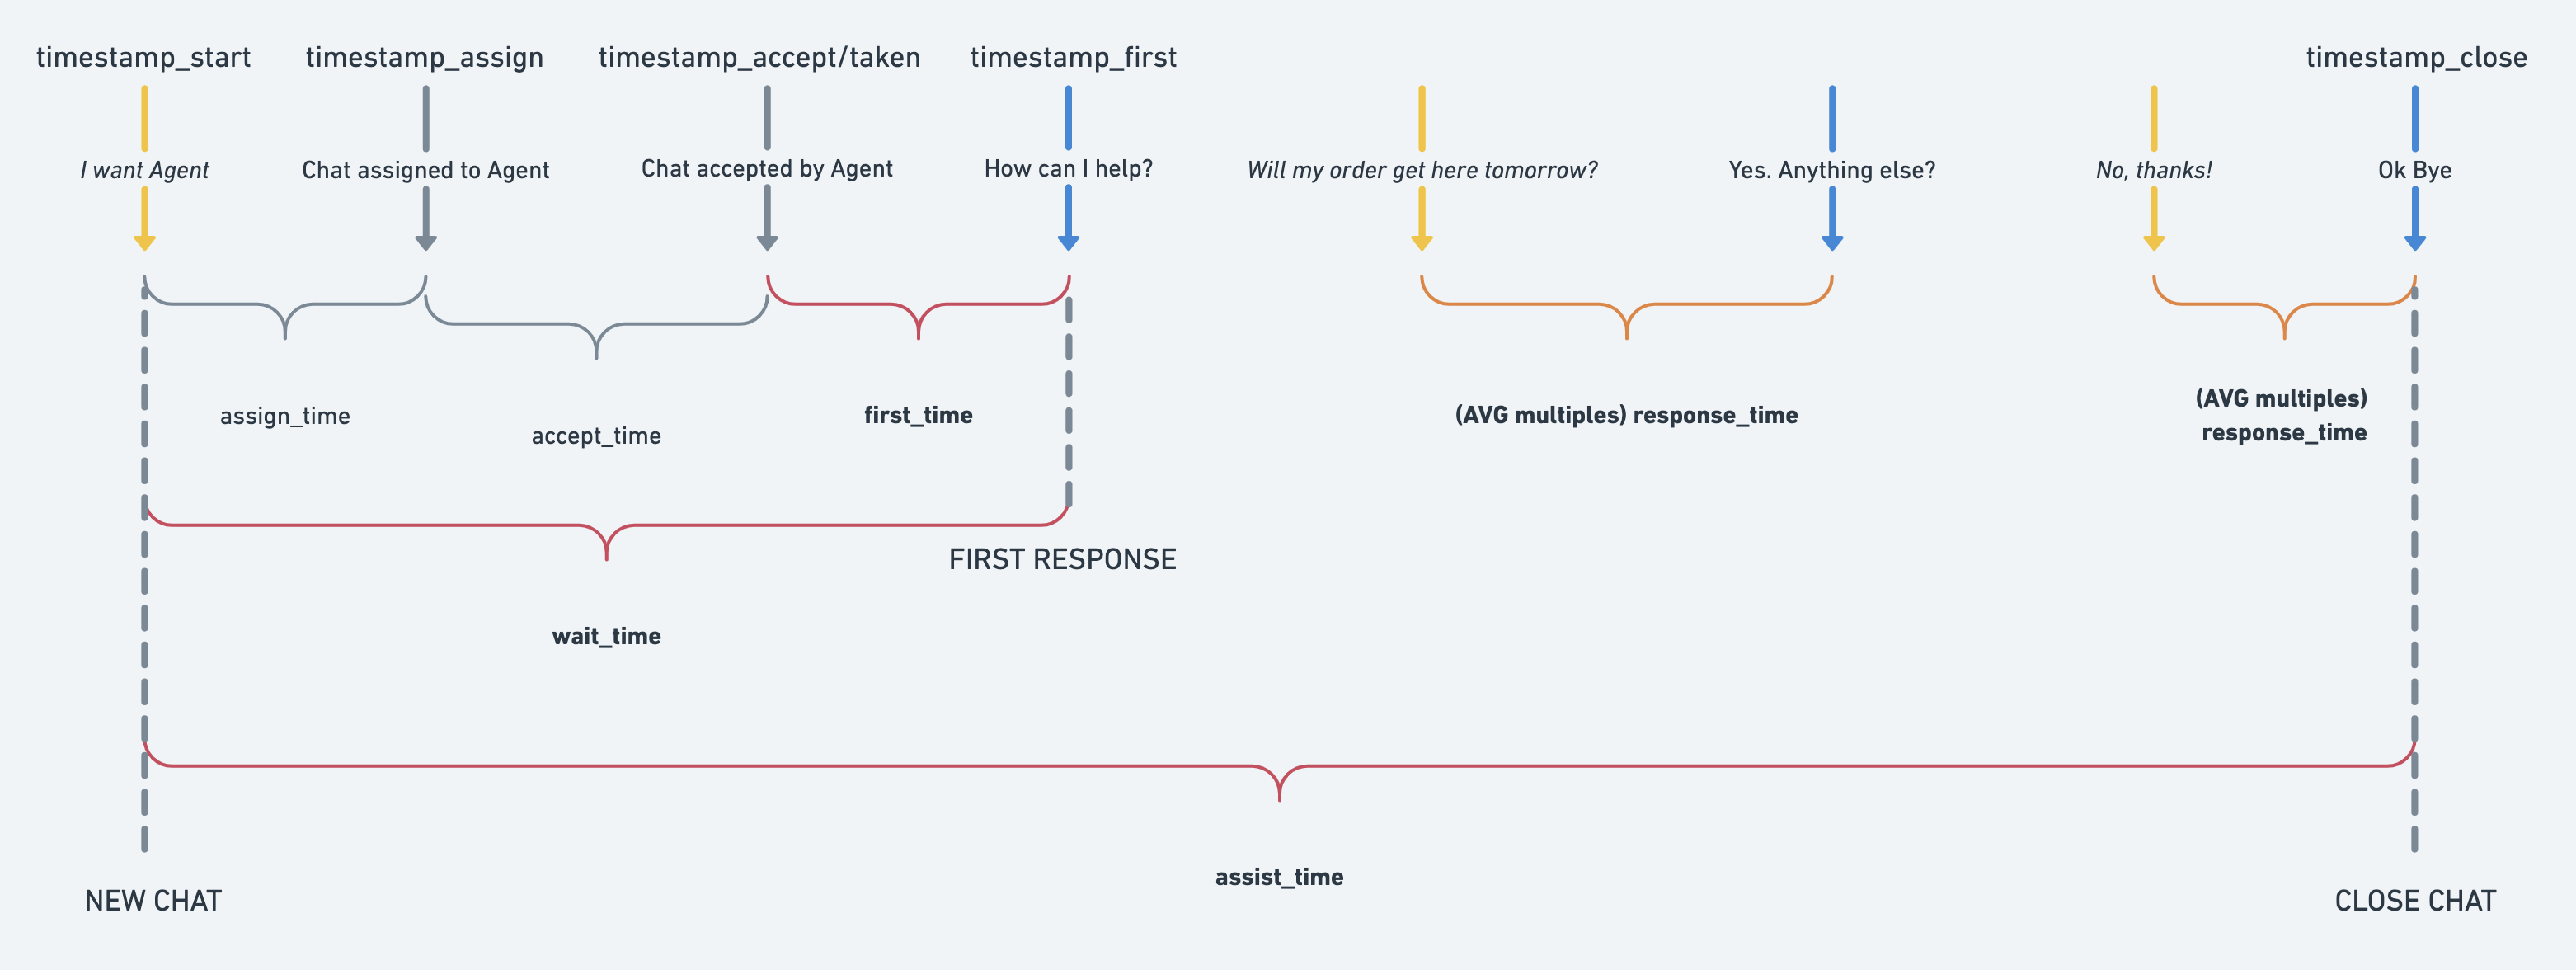
Details:
- **Assistance Time
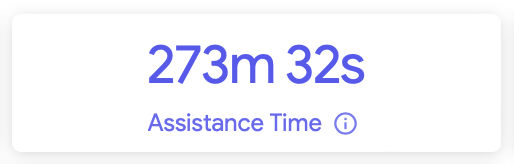
Business Value: This card shows how long, on average, it takes for an agent to help a user from the moment the user requests assistance until their ticket is resolved. It helps us understand how efficiently our agents are addressing user needs.
Calculation: Average of assistance time (chat closed timestamp - chat opened timestamp) from all the records in the analysis interval
- **Waiting Time
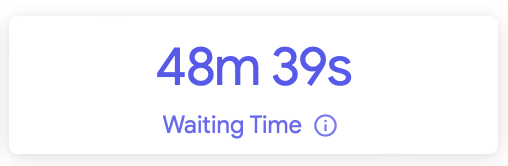
Business Value: This card shows how long, on average, it takes for the first response from an agent after a user requests assistance. It helps us understand how much the user have to wait in order to be assisted.
Calculation: Average of waiting time (agent first response timestamp - chat opened timestamp) from all the records in the analysis interval.
- **First Response Time
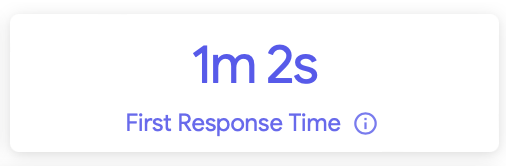
Business Value: This card shows how long, on average, it takes for the first response from an agent after the agent receive the assistance request in the Salesdesk platform. It helps us understand how quick our agents replies to users.
Calculation: Average of first response time (agent first response timestamp - chat queued timestamp) from all the records in the analysis interval.
- **Business Questions
1. How many chats were helped by a human agent during a specific time frame?
[ You can see this on the Assisted Chats card]
2. How many chats were abandoned by the user during a specific time frame?
[You can see this on theChats Abandoned card]
3. How many distinct users requested agent assistance on the flow during a specific timeframe?
[You can see this on the Assisted Users card]
4. How long, on average, does it take for an agent to help a user from the moment the user requests assistance until their ticket is resolved? [You can see this on the Assistance Time card]
5. How long, on average, does it take for the first response from an agent after a user requests assistance? [You can see this on the Waiting Time card]
6. How long, on average, does it take for the first response from an agent after the agent receives the assistance request in the Salesdesk platform? [You can see this on the First Response Time card]
Tiles Section 📊
- **Assisted Chats Over Time
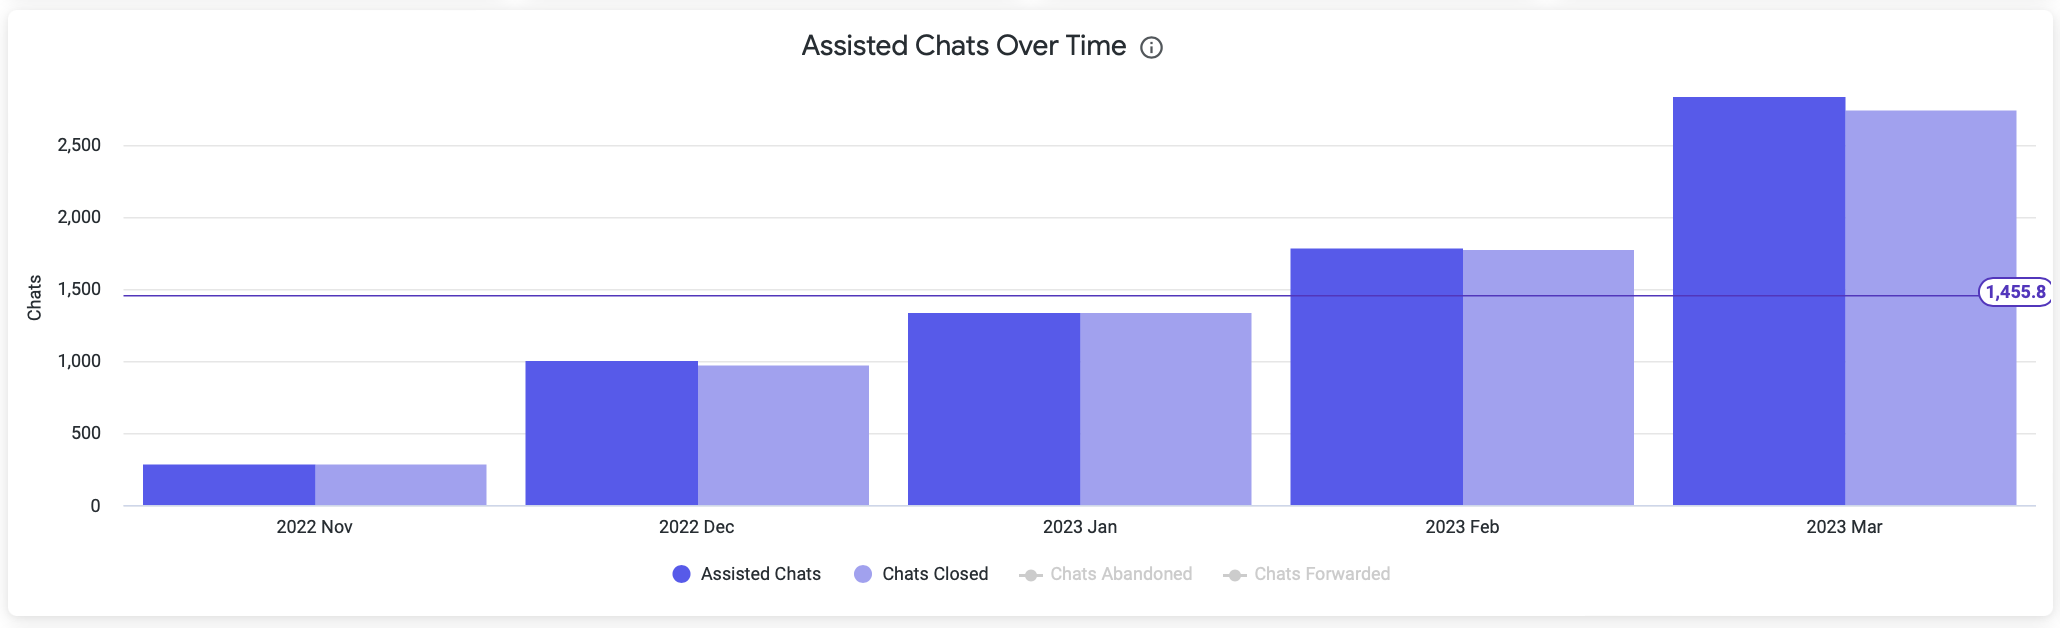
Business Value: This tile shows you how many chats were helped and closed during a specific time period. You can also see how many chats were abandoned or forwarded. All of this information is displayed in time buckets that you can specify using the time aggregation filter.
Calculation:
• For assisted chats: Count distinct of flow_id, ticket_id and rank_agent fields.
• For closed chats: Count distinct of flow_id, ticket_id and rank_agent fields where the status of the chat is closed.
• For abandoned chats: Count distinct of flow_id, ticket_id and rank_agent fields where the status of the chat is closed and the flag of abandoned was activated.
- **Chats Funnel
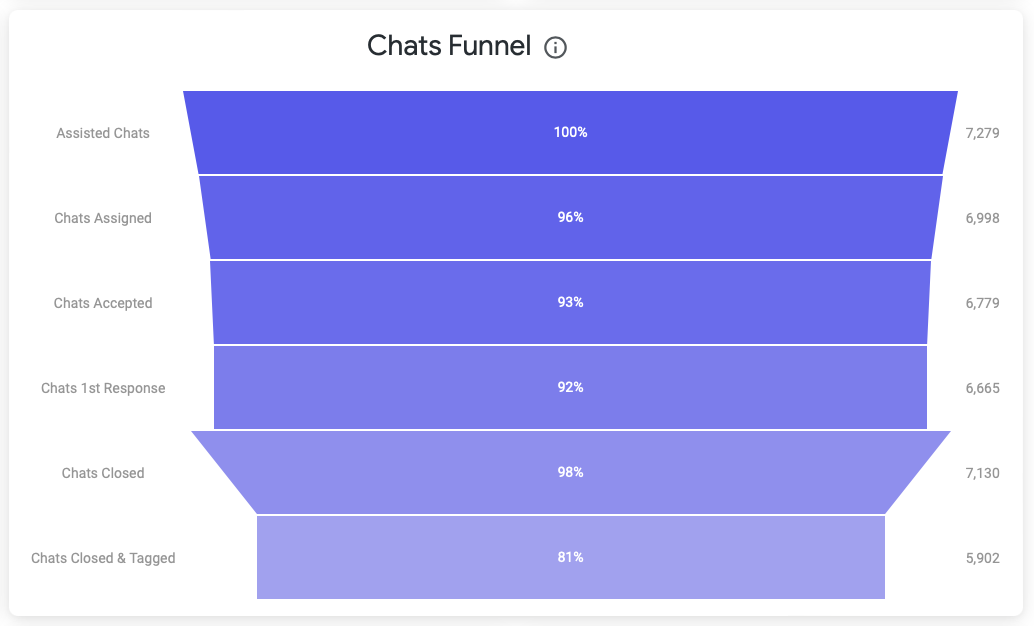
Business Value: This chart shows a funnel with different stages that a chat can go through, from the moment it is created until it is closed. The stages are:
• Total quantity of chats assisted
• Assigned (when an agent is assigned to the chat)
• Accepted (when the agent accepts the chat)
• With agent 1st response (when the agent responds to the user)
• Closed (when the chat is closed)
• Closed & tagged (when the chat is closed and a tag is added to it)
This chart can help you understand the flow of a chat and the different stages it goes through, as well as the percentage of chats that reach each stage.
Calculation:
• For assisted chats: Count distinct of flow_id, ticket_id and rank_agent fields.
• For assigned chats: Count distinct of flow_id, ticket_id and rank_agent fields where the status of the chat is assigned.
• For accepted chats: Count distinct of flow_id, ticket_id and rank_agent fields where the status of the chat is accepted.
• For chats 1st response: Count distinct of flow_id, ticket_id and rank_agent fields where the status of the chat is 1st response.
• For closed chats: Count distinct of flow_id, ticket_id and rank_agent fields where the status of the chat is closed.
• For closed & tagged chats: Count distinct of flow_id, ticket_id and rank_agent fields where the status of the chat is closed and at least one tag was added to the ticket.
- **Assisted Users Over Time
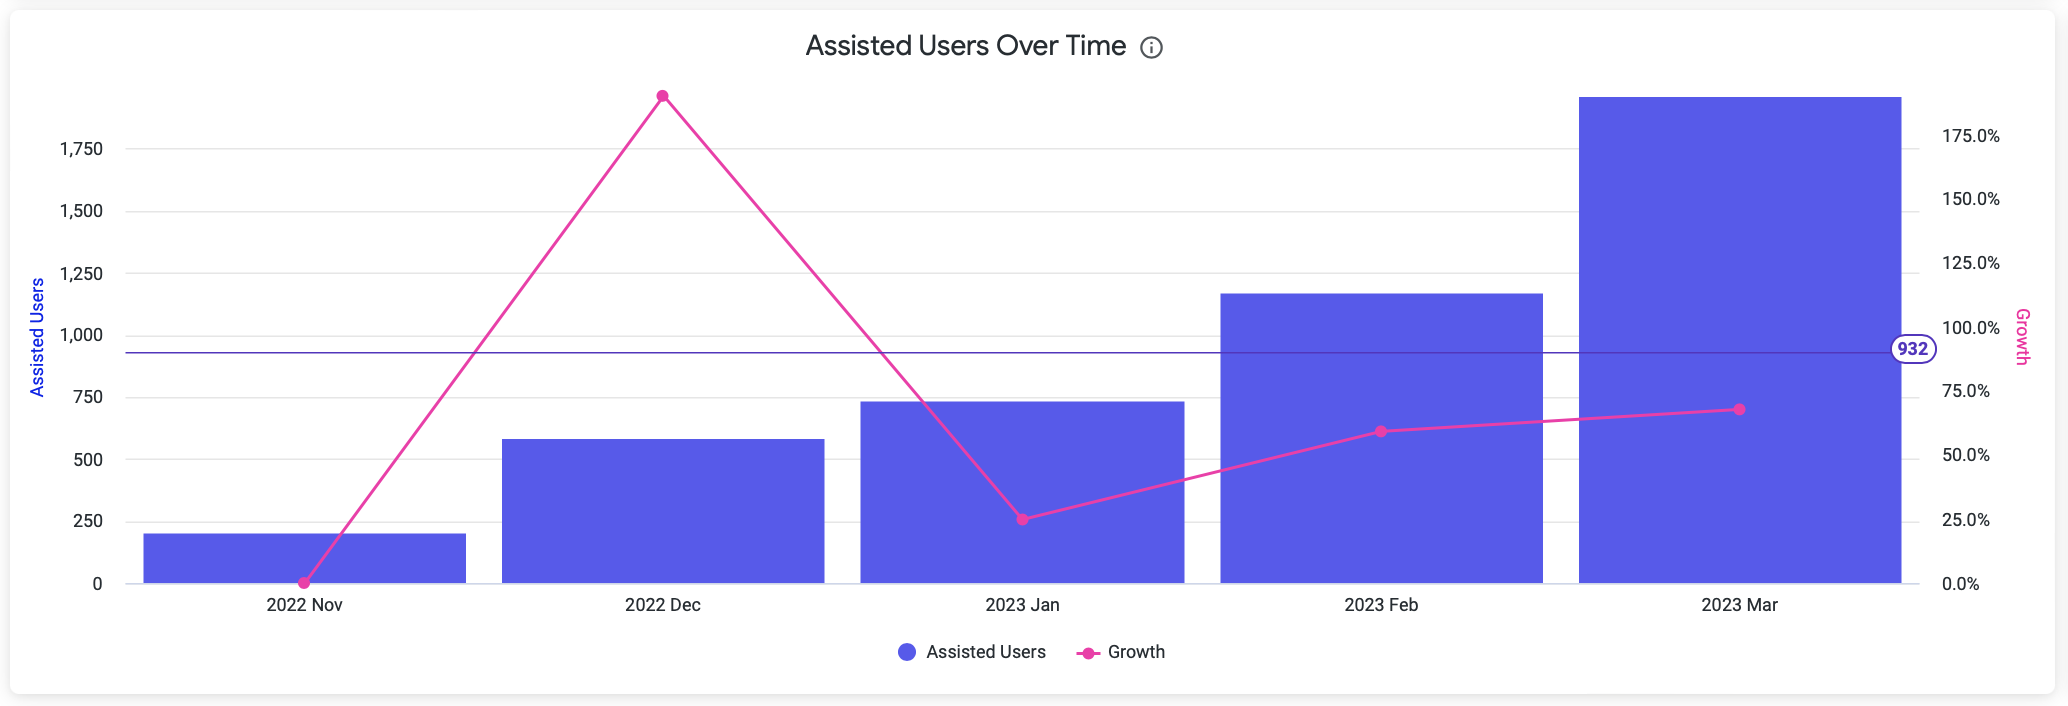
Business Value: This tile shows you how many distinct users were assisted in Salesdesk by period (time aggregation selected) during a specific time frame. Also, you can get the growth of assisted users in comparison from the previous period.
Calculation:
• For assisted users: Count distinct of flow_id, user_id fields in the analysis interval.
• For growth: Count of assisted users from the period divided by the count of assisted users from the previous period minus one.
G = (Ai/A{i-1}) - 1
- **Demand for Human Assistance
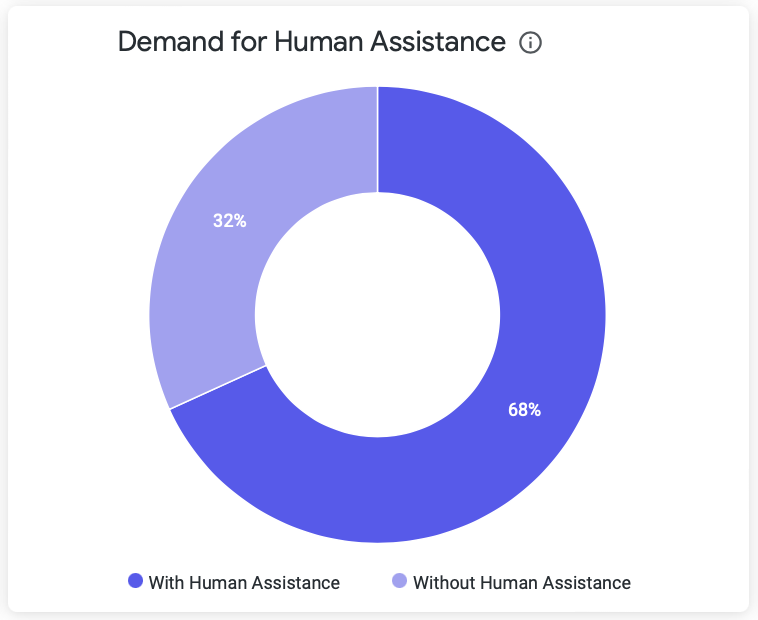
Business Value: This tile shows the percentage of conversations that required human assistances (it means that a Salesdesk ticket was created) and those that didn’t require in a specific timeframe. With this tile the customers can understand better the percentage of automation in their flows.
Calculation:
• For a conversation: It’s calculated when a user send at least one message to the flow.
🛠️ COUNT DISTINCT flow_id, user_id, date
• For a conversation with human assistance: It’s calculated when a user send at least one message to the flow and a Salesdesk ticket was generated into the conversation.
🛠️ COUNT DISTINCT flow_id, user_id, date, ticket_id
- **News vs Returning Assisted Users
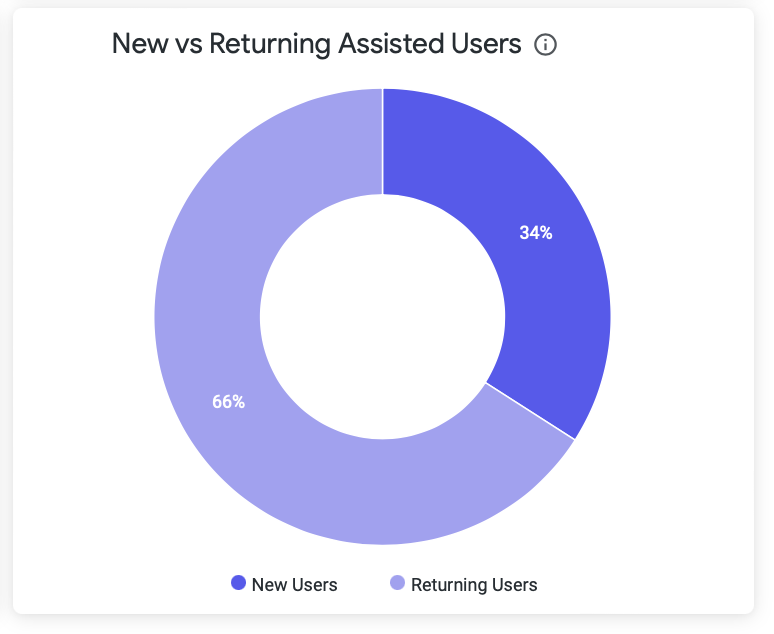
Business Value: This tile shows you the comparison between new users and returning users. New users are those who have never been helped by an agent before, while returning users have been helped before by an agent using Salesdesk.
Calculation:
• For new users: Count distinct of flow_id, user_id fields where the new_user flag is activated in the analysis interval.
• For returning users: Count distinct of flow_id, user_id fields where the new_user flag is not activated in the analysis interval.
- **Assisted Chats by Tag
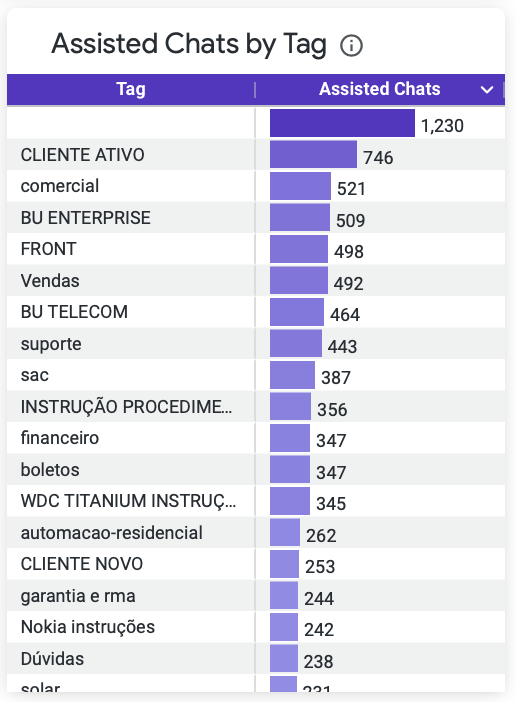
Business Value: This section of the document talks about a feature called "Assisted Chats by Tag". It shows the number of chats that have been tagged with different topics. This can help us understand what topics are the most common for users to ask about, and what topics agents are the most knowledgeable about. This information can be useful for improving the overall experience of using the Salesdesk platform.
Calculation: Count distinct of flow_id, ticket_id and rank_agent fields separated by tag.
Business Questions
- How many chats were helped and closed during a specific time period? [[ You can see this on the Assisted Chats Over Time card]]
- What is the flow of a chat and the different stages it goes through? [[ You can see this on the Chats Funnel card]]
- How many distinct users were assisted in Salesdesk during a specific time frame? [[ You can see this on the Assisted Users Over Time card]]
- What is the comparison between new users and returning users? [[ You can see this on the News vs Returning Assisted Users card]]
- What topics are the most common for users to ask about, and what topics are agents the most knowledgeable about? [[ You can see this on the Assisted Chats by Tag card]]
Updated 5 months ago