FAQs Dashboard
A view of the most commonly asked questions and the users’ satisfaction
Welcome to the Quick Start Guide of the FAQs Dashboard!
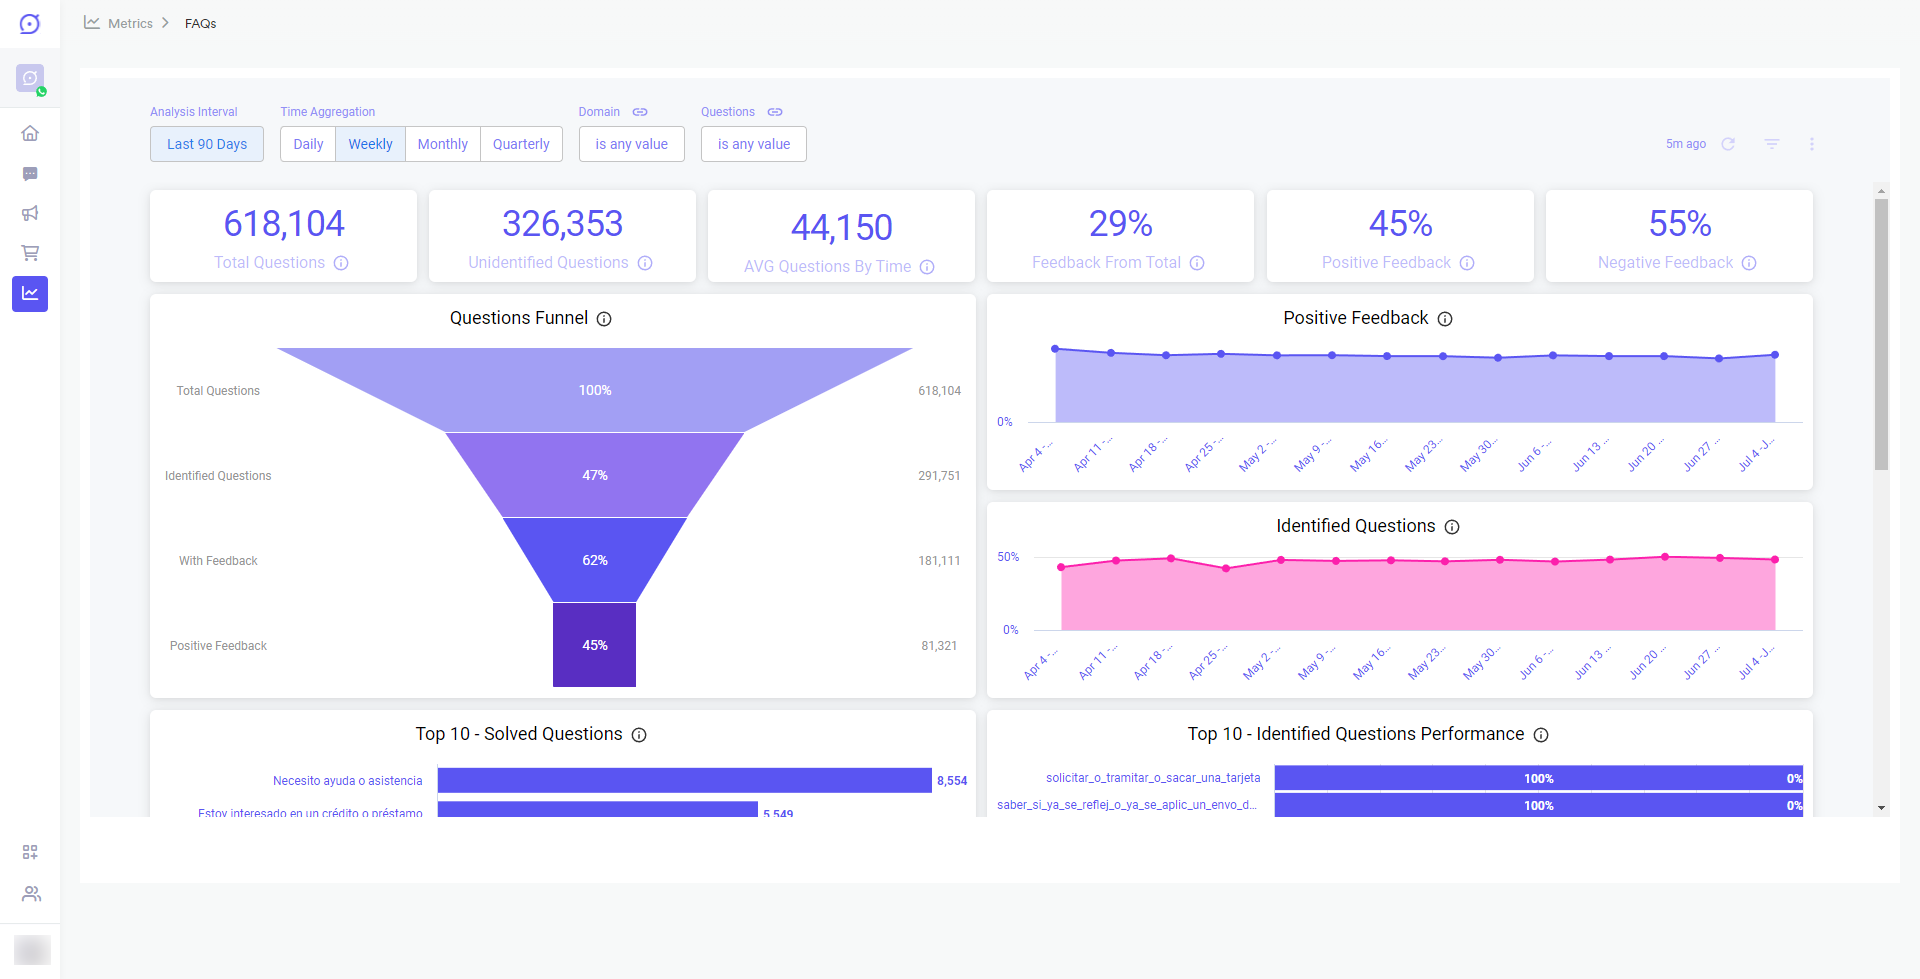
Yalo Studio - FAQs Dashboard
click the image to enlarge
The Frequently Asked Questions (FAQs) panel shows how Yalo's artificial intelligence (AI) implementation is used to extend the capabilities of a channel. This dashboard helps visualize how effective the solution is at identifying questions, providing actionable answers, and how often it has been used over time.
FAQs are part of a conversational flow that allows you to understand the natural language questions users ask while interacting with a channel. End users receive an automated response to their questions via a virtual agent built into Yalo Studio, which searches and responds via text by calculating the Semantic Similarity of a document to a knowledge base and target query.
This Quick Start Guide will show you how to learn, explore, and act about the FAQs Dashboard channel. You'll see the play-by-play you need to get the dashboard's basics under your belt, making you a seasoned expert in no time.
Learn
Obtain information about the number of questions your end-users asked and your channel's feedback, among other valuable data.
Explore
Filter by date, questions, or change the time aggregation based on your needs.
Act
Analyze the information, define the questions your customers are asking for, and focus them on the right path.
Before You Start
Prerequisites
Before you start this tutorial, make sure that:
- You have a Yalo Studio account.
- Time has passed since your Flow is active and data is available to analyze.
Build confidence by trying things on your own!
Go to the Analytics section (left on the main navigation panel), then click FAQs , and play around the dashboard!
Get familiar with the FAQs dashboard
The dashboard consists of four main rows.
First three Data Boxes
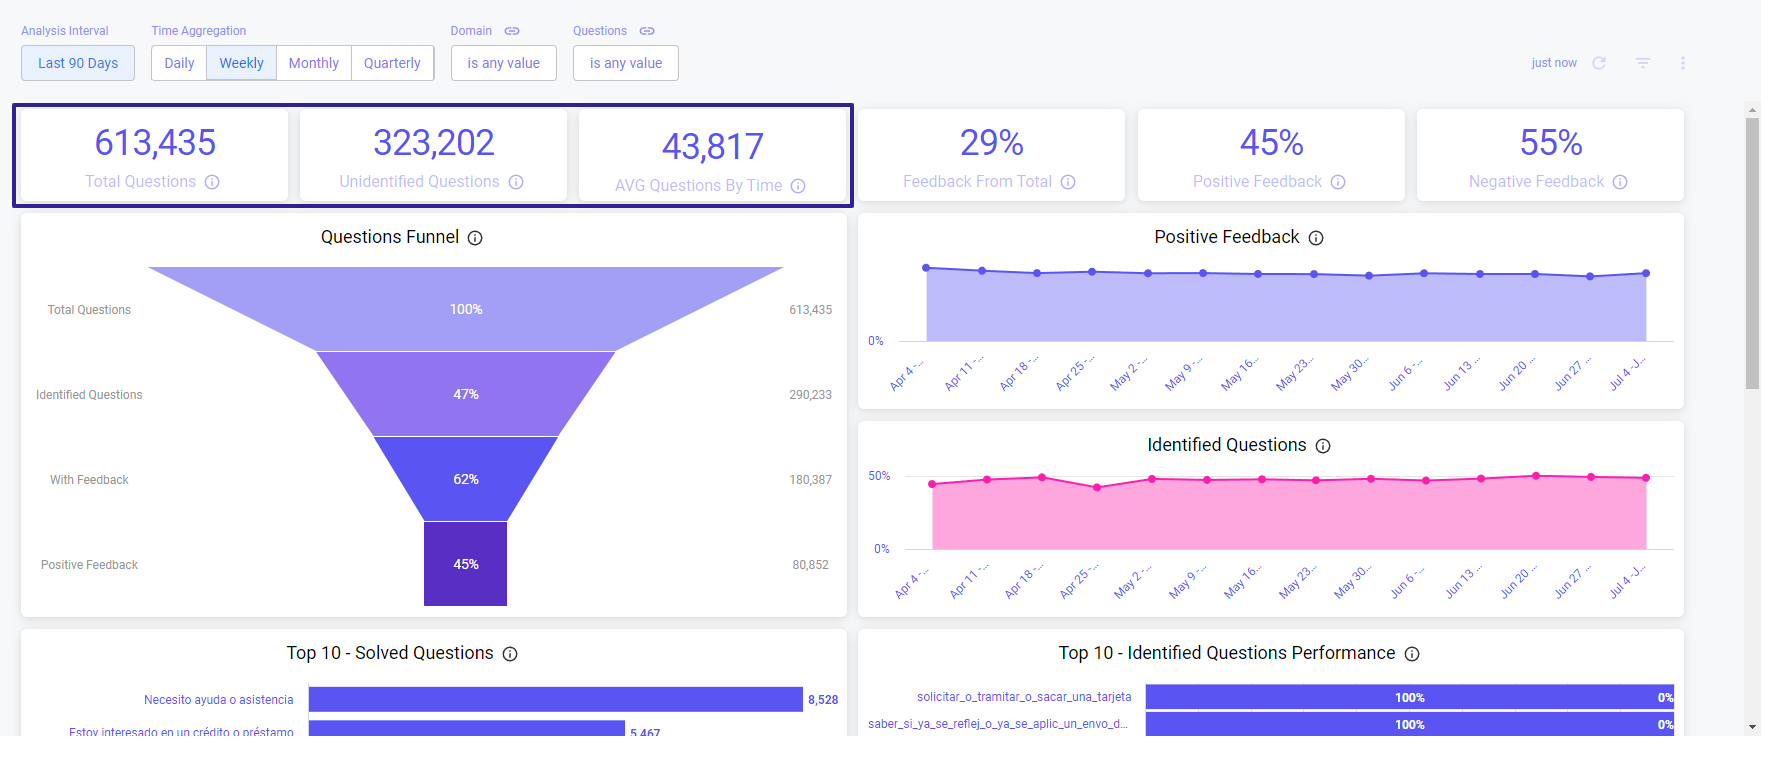
FAQs Dashboard main section, 1st set of Data Boxes selected
click the image to enlarge
Dashboard filters
At the top, there is a button to change the possible date ranges to see the information within the Interval Analysis. By default, it is ninety days.
Also, you can change the Time Aggregation, Domain, and Questions.
Time Aggregation
Allows you to select an aggregation level for the dashboard. This affects Data Boxes with a time axis.Domain
The domain is the FAQ activity contained within the Flow; each channel can have several. This filter shows a list of the different domains. This is useful if you have more than one knowledge base / FAQs activity in the same Flow.Questions
This filter shows the questions asked by end users. Affects only the top 10 question views. This is useful for comparing specific questions or displaying a question that is not in the top 10 without filtering. A list of knowledge base questions is available in the dropdown menu to make it easy to select the correct question.The filters narrow dashboard results to only the data you are interested in.
Yalo Tip
Download the data for deeper research, see the section Export Data at the bottom of this guide.
The next three Data Boxes
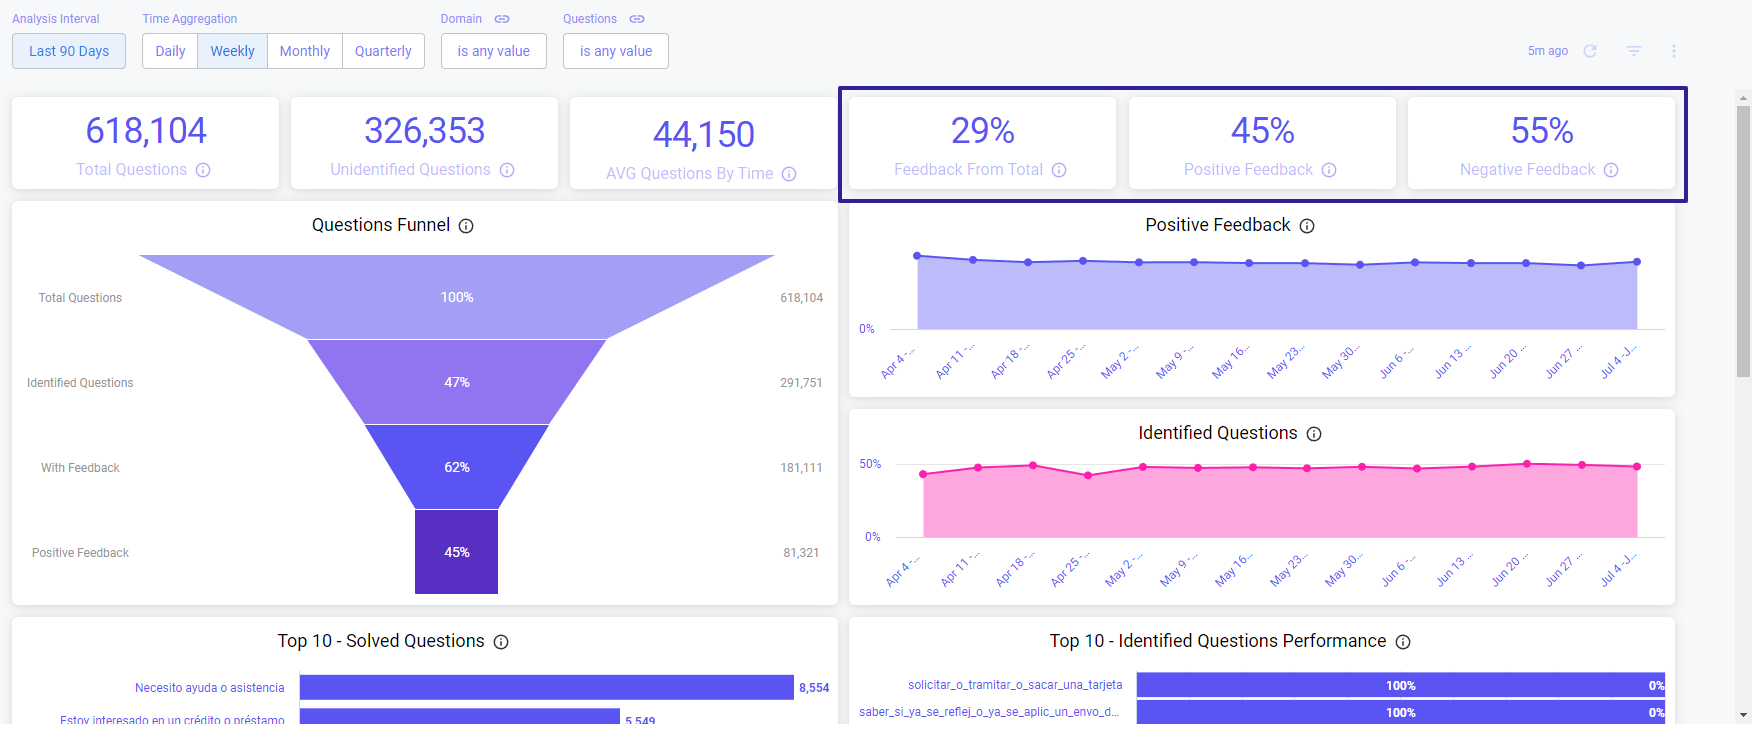
FAQs Dashboard main section, 2nd set of Data Boxes selected
click the image to enlarge
Questions Funnel and Feedback Graphics
Funnel showing percentage of questions from the prior row making up that row for the selected Interval Analysis.

FAQs Dashboard main section - Questions Funnel, and Feedback Graphics
click the image to enlarge
Yalo Tip
Hover over the funnel and the graphics to see information in the Interval Analysis.
Top 10 Section - Questions

FAQs Dashboard Top 10 section, with two graphics showing Solved Questions and Identified Questions Performance
click the image to enlarge
Yalo Tip
Click the legend to toggle question categories.
Questions Over Time
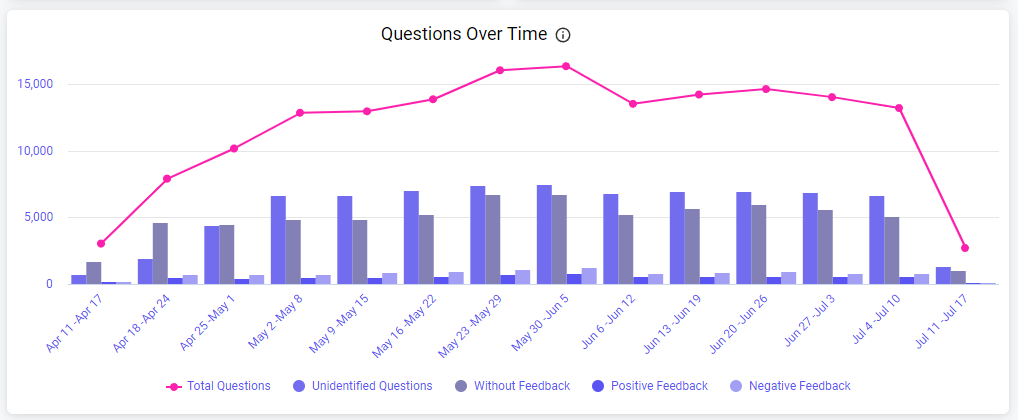
FAQs Dashboard Questions Over Time section, with one graphic showing the total of Questions received by the Flow
click the image to enlarge
This last visualization helps break down every category into the time axis. It can be useful if you already know what you’re looking for to click and drill down into something specific (date and category-wise).
The categories are:
- Total Questions
- Unidentified Questions
- Without Feedback
- Positive Feedback
- Negative Feedback
You can click on each category to filter activate/deactivate it, for deeper analysis.
Yalo Tip
Click the legend to toggle question categories shown by the time aggregation period in the time frame.
Export Data
You can download data from each Data Box within the FAQs Dashboard, in several formats, such as CSV, Excel, JSON, HTML, and Markdown, among others.
To export the data:
- Click on the three-dot menu at the top right of the Data Box.
- Then click on the Download data button.
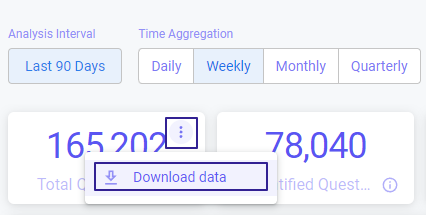
Three-dot menu and Download data pop-up selected in a FAQs Dashboard Data Box
click the image to enlarge
- In the pop-up, choose the type of format you want.
- Click on Advanced data options
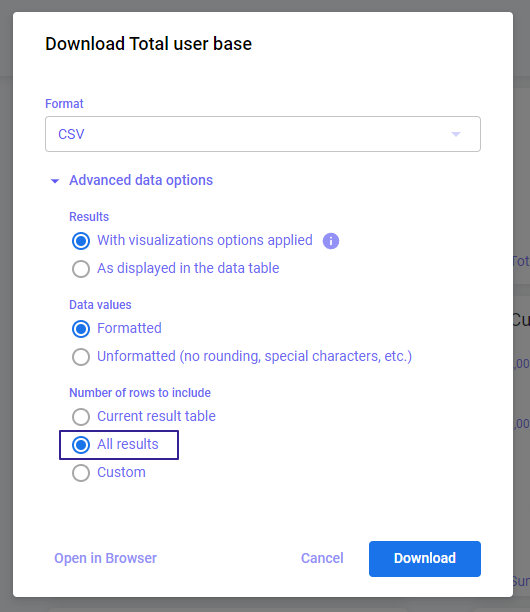
Exporting Data pop-up with "All results" option selected
click the image to enlarge
We recommend leaving the rest of the checks marked as they are, only changing the field: Number of rows with the value: All Results, so that the data export is correctly generated.
- Click Download
- Save the file for further analysis.
If "All Results" is not available
Downloading an unlimited number of results is restricted for queries with table calculations.
To download more than "Results in Table", select "Custom" and enter a limit of up to 100,000 rows.
Updated about 2 years ago
