Overview Dashboard (Legacy)
A high-level view of a channel's analytics, a quick summary of your channel’s performance
Important note
This is an old version of the Overview Dashboard, for the new version, please go to this page: Overview v2.0 Dashboard .
Welcome to the Quick Start Guide of the Overview Dashboard!
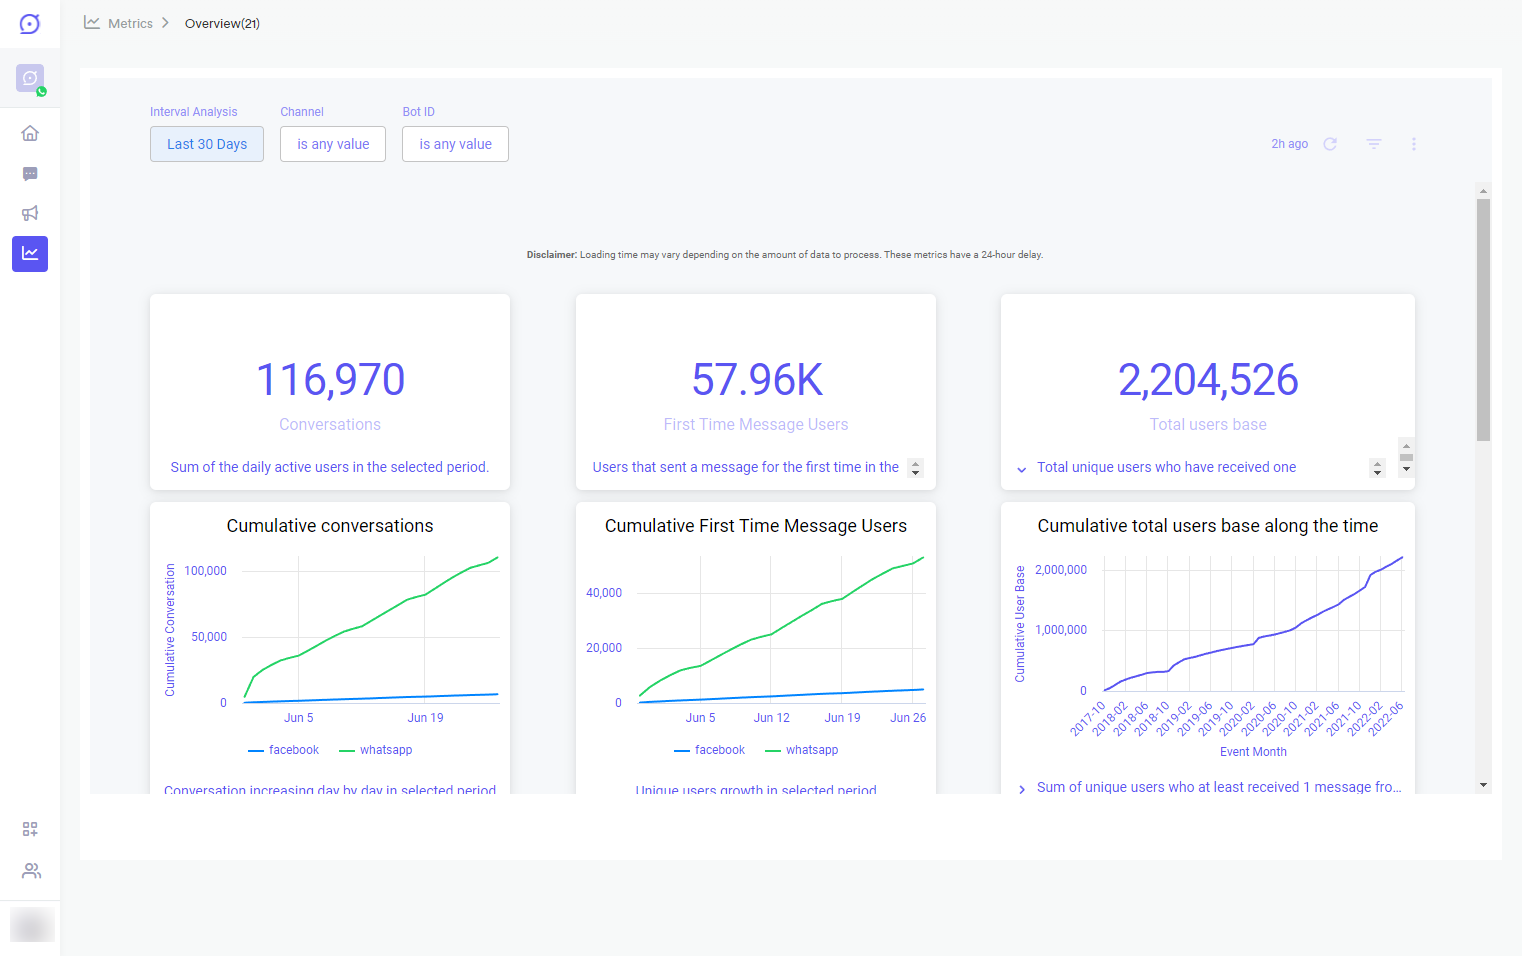
Yalo Studio - Overview Dashboard
click the image to enlarge
The Overview Dashboard provides a centralized, high-level view of a channel's indicators.
This Quick Start Guide will help you learn, explore, and interact with your channel's Overview Dashboard. You will know the critical aspects necessary to master the basic concepts of the dashboards, making you an expert in no time.
Learn
Obtain information about your conversations and the total users of your channel.
Explore
Filter by date, campaign, or Flow ID based on your needs.
Act
Analyze the information and decide to define your campaigns on what's essential for your goals and focus them on the right path.
Before You Start
Prerequisites
Before you start this tutorial, make sure that:
- You have a Yalo Studio account.
- Time has passed since your Flow is active and data is available to analyze.
Build confidence by trying things on your own!
Go to the Analytics section (left on the main navigation panel), then click Overview , and then play around the dashboard!
Get familiar with the Overview dashboard
The page is made of three main columns and three rows, plus the Automation section.
The first three Data Boxes are these:
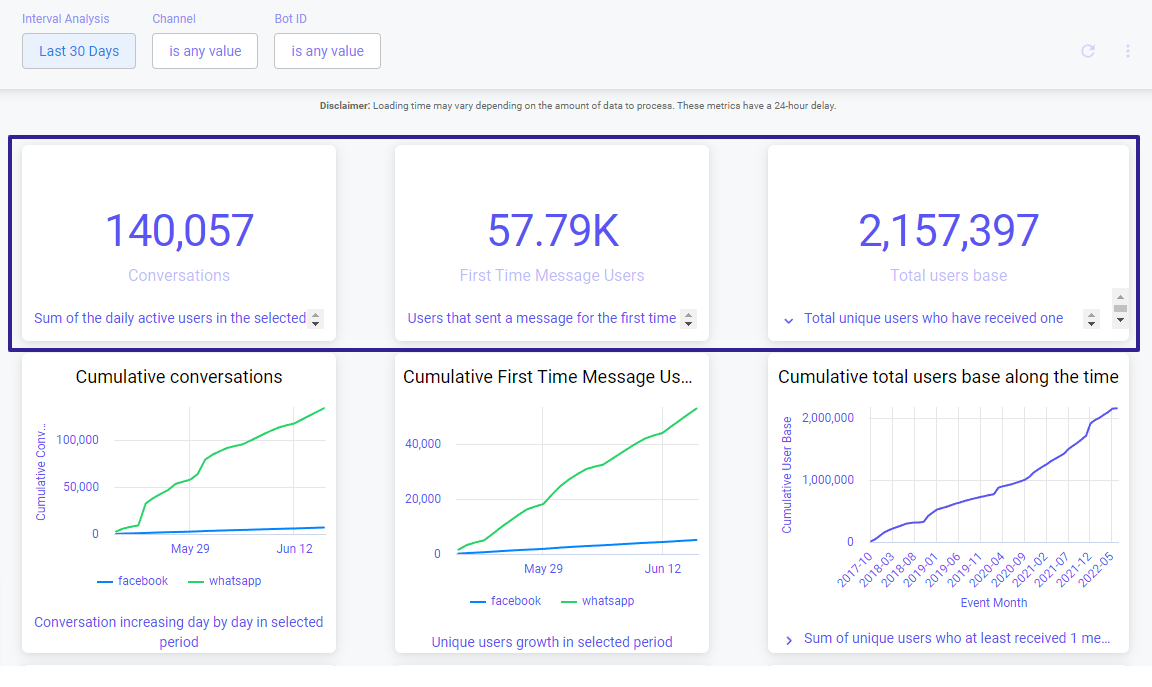
Overview dashboard main section - three Data Boxes selected
click the image to enlarge
Active user: User who has already received or sent a message.
Dashboard filters
At the top, there is a button where you can change the possible date ranges to see the information within the Interval Analysis. By default, it is thirty days.
Also, you can change the Channel and FlowID, in case there is more than one.
Channel = The interface where users can interact with Flows through written texts, quick replies, and webviews. In Yalo, we release Flows in two channels: Facebook Messenger and WhatsApp.
FlowID = The identifier of the Flow configured in Yalo Studio.
The filters narrow dashboard results to only the data you are interested in.
Yalo Tip
Download the data for deeper research, see the section Export Data at the bottom of this guide.
Cumulative Data and Comparisons
The next three Data Boxes are graphs with cumulative growth over time.
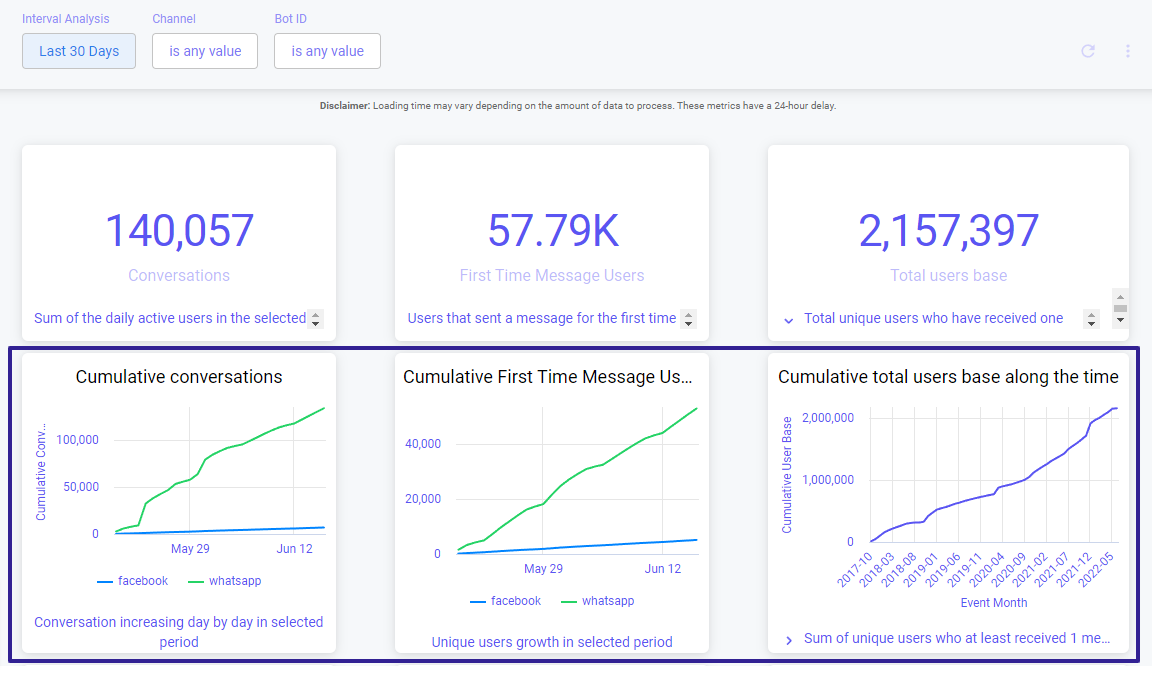
Cumulative comparison section in the Overview Dashboard
click the image to enlarge
Yalo Tip
Hover over the green and blue lines to see the information in the Interval Analysis.
Conversations, 1st-Time Users, and Total Messages of Your Channel

Conversation graphs and total messages of your channel
click the image to enlarge
Yalo Tip
You can export the data to further research, see the section Export Data at the bottom of this guide.
Automation
This row shows data about how conversational commerce helped your channel to achieve greater communication with your users.

Automation section with Data Boxes highlighted
click the image to enlarge
Showing the number for each channel, in case you have both WhatsApp and Facebook Messenger.
Cumulative Savings by Using Your Flow
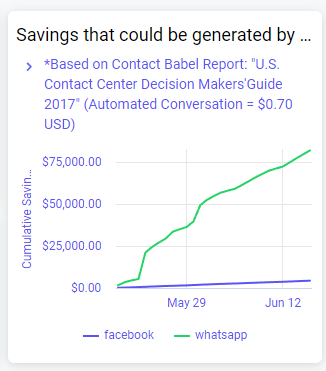
Graph with estimated savings using both WhatsApp and Facebook Messenger channels
click the image to enlarge
This graph shows the estimated savings generated by commercial conversations that didn't reach an agent during the Interval Analysis.
Showing the number for each channel, in case you have both WhatsApp and Facebook Messenger.
- The estimate is based on Contact Babel Report: "U.S. Contact Center Decision Makers' Guide 2017". The rate is Automated Commerce Conversation = USD $0.70.
Export Data
You can download data from each Data Box within the Overview Dashboard, in several formats, such as CSV, Excel, JSON, HTML, and Markdown, among others.
To export the data:
- Click on the three-dot menu at the top right of the Data Box.
- Then click on the Download data button.
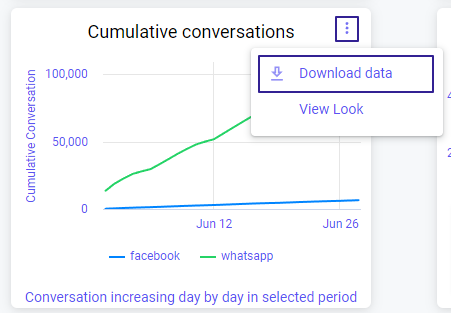
Three-dot menu and Download data pop-up selected in a Dashboard Data Box
click the image to enlarge
- In the pop-up, choose the type of format you want.
- Click on Advanced data options
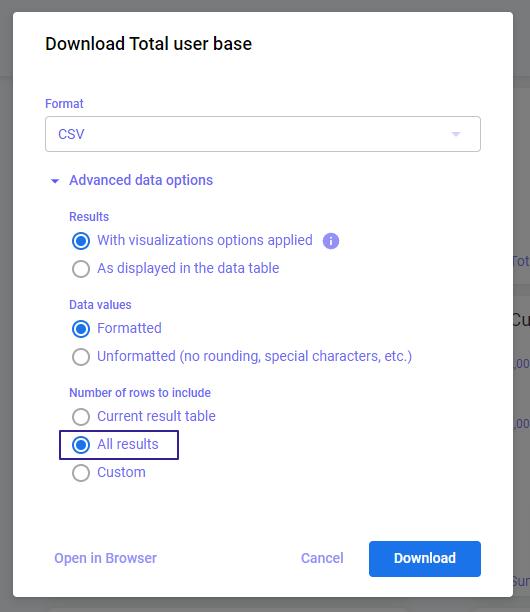
Exporting Data pop-up with "All results" option selected
click the image to enlarge
We recommend leaving the rest of the checks marked as they are, only changing the field: Number of rows with the value: All Results, so that the export of data gets correctly generated.
- Click Download
- Save the file for further analysis.
If "All Results" is not available
Downloading an unlimited number of results is restricted for queries with table calculations.
To download more than "Results in Table", select "Custom" and enter a limit of up to 100,000 rows.
Looks
Some of the Data Boxes within the Overview Dashboard have the option View Look. By selecting that option, you will see the content of the Data Box in more detail to perform a deeper analysis; this is called a Look.
The Look will show all the data since the beginning of the Flow.
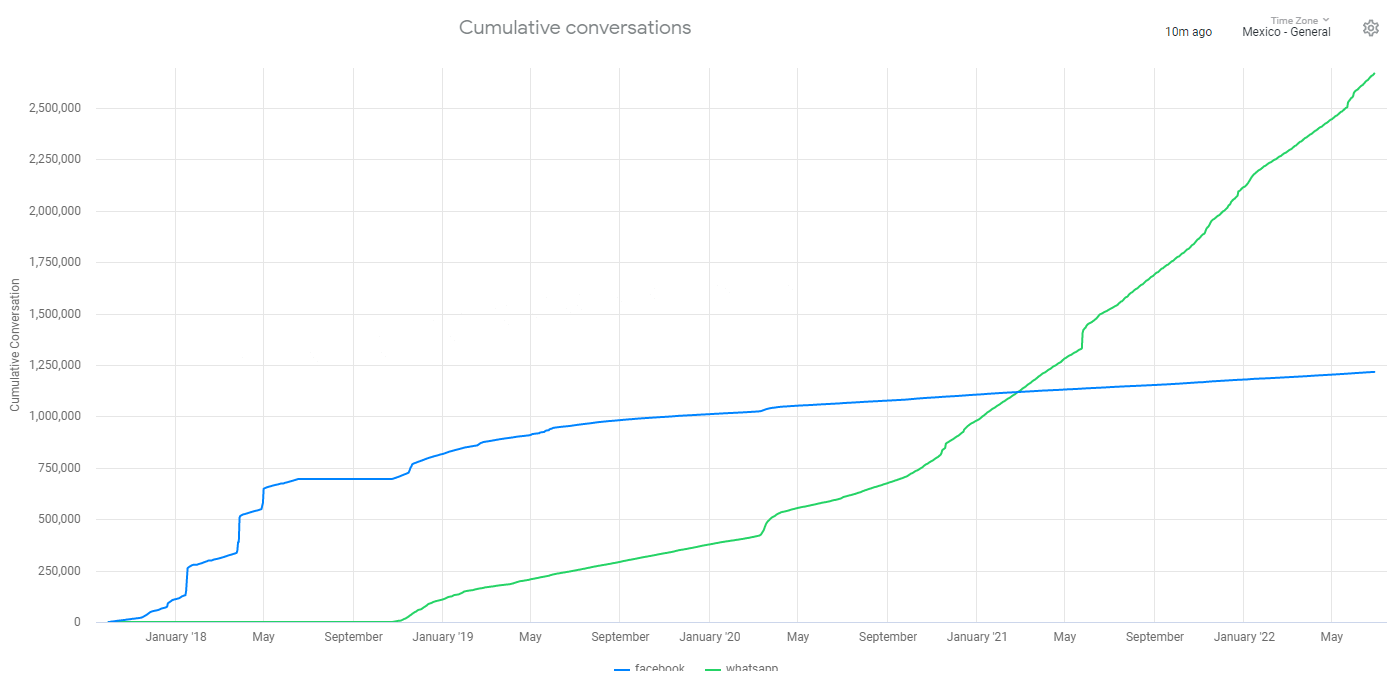
Look from a Data Box within the Overview Dashboard
click the image to enlarge
To see the Look:
- Click on the three-dot menu at the top right of the Data Box.
- Then click on View Look button.
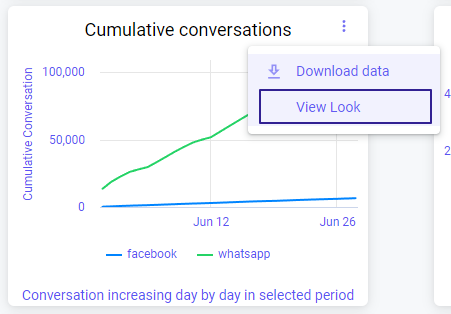
View Look button selected in a Dashboard Data Box
click the image to enlarge
If you need to go back, click on the Analytics button (left on the main navigation panel), then click another Dashboard, and then Overview.
Updated over 1 year ago
